


Maps

Maps: How Much of Your City is Parking?
The percentage of land dedicated to parking in the central districts of major U.S. cities ranges from 4 percent to as much as 42 percent.

Mapping Climate Impact at the Neighborhood Level
A consumption-based analysis illustrates the differences in average household emissions across census tracts.
Top Websites for Urban Planning - 2022
Every year, Planetizen collects the websites breaking new digital ground in the world of planning and related fields.
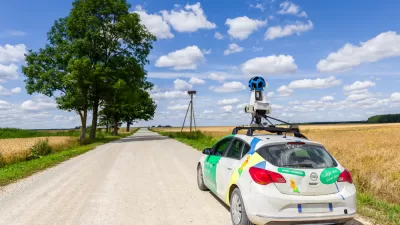
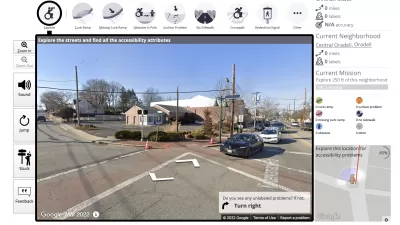
How Digital Mapping Can Reinforce Inequity
Digital mapping tools like Google Street View often obscure the realities of cities and concentrate their resources in the wealthiest countries, effectively ‘erasing’ some places from the global map.

Mapping Richmond’s Displaced Communities
A new project catalogs the city’s history of displacement and its impact on communities of color.

Mapping Biodiversity Risk
A partnership of researchers has created the most detailed map yet of the places where biodiversity is most at risk in the United States.

How the National Park Service Uses GIS
A new book demonstrates how the National Park Service uses GIS technology to meet its mission and showcases a selection of maps used for effectively managing national parks.

Partisan Clustering at the Neighborhood Level
Forget red state versus blue state: a new data analysis and mapping project by The New York Times shows that the political divides in the country can be mapped to the neighborhood level within metropolitan areas.
The Connecticut Zoning Atlas Illustrates a Proclivity for Single-Family Zoning
A new online interactive mapping tool illustrates just how much developable land is devoted to one for of residential housing in the state of Connecticut.
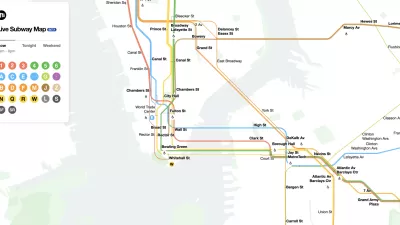
The New New York Subway Map Works in Real Time
There's a new chapter, and maybe an end, for the "Great Subway Map Debate."

New Google Map Layer Shows COVID-19 Infection Rates
A new layer showing the seven-day average of confirmed COVID-19 cases started rolling out to Android and iPhones last week.

Using Artificial Intelligence to Map Telecommuting Prevalence
In the Philadelphia region, residents of wealthier neighborhoods will be more likely to work from home in the future, thus altering travel patterns and transit usage, according to a new mapping project powered by artificial intelligence (AI).

Do You Know Your COVID-19 Colors?
Harvard University's Global Health Insititute and Edmond J. Safra Center for Ethics have launched a new online tool for planners, policy makers, and the public to determine the severity of the coronavirus outbreak in one's county and state.

Friday Eye Candy: A Sorely-Needed Map of New York City Neighborhoods
Neighborhoods don't get the same official boundaries as cities, counties, states, and countries. So how do we know where one neighborhood ends and another begins?

Better Maps Would Save Delivery Companies a Ton of Time and Money
A new report estimates the cost of inaccurate maps for delivery companies in the billions of dollars.

Mapping the Land Uses of the United States
The McHarg Center's "The 2100 Project: An Atlas for the Green New Deal" provides a series of maps an infographics to illustrate the way the United States uses land.

Winter Friday Fun: A Map of the Best Sledding Spots
There's a map of Boston that points out all the best sledding spots. It seems like there are millions of kids living in other parts around the country that could benefit from a sledding map of their hometown.

Friday Funny: A Font Made From the Maps of Congressional Districts
Meet the Ugly Gerry font.

Multi-Modal Directions, Now Available on Google Maps
Under the transit tab on Google Maps, users will now be able to incorporate trips that start on a bike but end on a bus, train, or other mode of transport.

Coming Soon: A New Transit Map for Philadelphia
Transit is getting a new look.
Urban Design for Planners 1: Software Tools
This six-course series explores essential urban design concepts using open source software and equips planners with the tools they need to participate fully in the urban design process.
Planning for Universal Design
Learn the tools for implementing Universal Design in planning regulations.
Heyer Gruel & Associates PA
Ada County Highway District
Institute for Housing and Urban Development Studies (IHS)
City of Grandview
Harvard GSD Executive Education
Toledo-Lucas County Plan Commissions
Salt Lake City
NYU Wagner Graduate School of Public Service


