


A partnership of researchers has created the most detailed map yet of the places where biodiversity is most at risk in the United States.
The New York Times recently shared a map touted as the most detailed documentation of biodiversity risk ever created. The map raises questions, addressed in the source article, about how to protect biodiversity on the nation's private and public lands.
The map, based on research published in the journal Ecological Applications, was created by NatureServe and a network of state partners, the geographic mapping platform Esri, and the Nature Conservancy.
Catrin Einhorn and Nadja Popovich wrote the article that accompanied the map for the New York Times. The writers dig into the findings and methodology of this ambitious research, revealing a lot of nuance about the existential risk to biodiversity in the United States because of environmental degradation and climate change and the tools the country has available to effectively protect species without risking unintended consequences.
The article also puts the details of the map in context of an evolving conversation about the role of public land in preserving biodiversity in the United States. "California is leading the way in tackling some of these challenges," write Einhorn and Popovich. "It has more land under biodiversity protection than any other of the lower 48 states, but it’s also home to high concentrations of imperiled species that live outside of those areas."
As noted in the article, president Joe Biden announced the "American the Beautiful" plan in May 2021 to protect 30 percent of the land in the country by 2030—a tripling of the amount of protected land in the country in less than a decade that follows the "30 by 30" model.
FULL STORY: This Map Shows Where Biodiversity Is Most at Risk in America

Can the U.S. Preserve 30 Percent of its Lands and Waters?
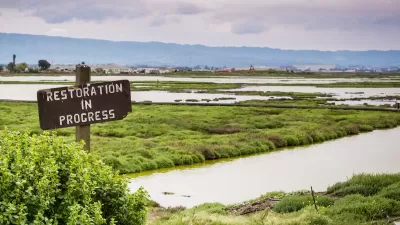
The Biden administration released its preliminary report on a plan to conserve 30 percent of the nation's lands and waters by 2030, one big, ambitious component of the administration's climate plans.
Nature-Based Solutions for Sustainable Climate Action
These solutions offer cost-effective, sustainable methods to combat climate change, but require government action to reallocate subsidies, integrate natural assets into financial systems, and develop biodiversity credit markets.

Even Small Urban Green Spaces Boost Biodiversity
A recent study from the University of Melbourne demonstrates the positive impacts small urban greening projects can have on city ecosystems.

Alabama: Trump Terminates Settlements for Black Communities Harmed By Raw Sewage
Trump deemed the landmark civil rights agreement “illegal DEI and environmental justice policy.”

Study: Maui’s Plan to Convert Vacation Rentals to Long-Term Housing Could Cause Nearly $1 Billion Economic Loss
The plan would reduce visitor accommodation by 25% resulting in 1,900 jobs lost.

Why Should We Subsidize Public Transportation?
Many public transit agencies face financial stress due to rising costs, declining fare revenue, and declining subsidies. Transit advocates must provide a strong business case for increasing public transit funding.

Paris Bike Boom Leads to Steep Drop in Air Pollution
The French city’s air quality has improved dramatically in the past 20 years, coinciding with a growth in cycling.

Why Housing Costs More to Build in California Than in Texas
Hard costs like labor and materials combined with ‘soft’ costs such as permitting make building in the San Francisco Bay Area almost three times as costly as in Texas cities.

San Diego County Sees a Rise in Urban Coyotes
San Diego County experiences a rise in urban coyotes, as sightings become prevalent throughout its urban neighbourhoods and surrounding areas.
Urban Design for Planners 1: Software Tools
This six-course series explores essential urban design concepts using open source software and equips planners with the tools they need to participate fully in the urban design process.
Planning for Universal Design
Learn the tools for implementing Universal Design in planning regulations.
Smith Gee Studio
Alamo Area Metropolitan Planning Organization
City of Santa Clarita
Institute for Housing and Urban Development Studies (IHS)
City of Grandview
Harvard GSD Executive Education
Toledo-Lucas County Plan Commissions
Salt Lake City
NYU Wagner Graduate School of Public Service