


Looking for granular illustrations of the details of local economies? Look no further.
Emily Badger shares news of a new data mapping project that shows every job in the United States:
"[Economic differences] form economic identities that shape each city as much as their culture and geography do. And they're starkly — and beautifully — visible in a new visualization, made by Harvard Ph.D. student Robert Manduca, that maps nearly every job in America, one dot per job. His project, which draws on Census data reported by employers, is modeled off Dustin Cable's well-known racial dot map that mapped every person in the country."
The map uses red dots to represent manufacturing and trade; blue dots for professional services; green dots for healthcare, education, and government; and yellow dots for retail, hospitality, and other services.
Laura Bliss also picked up on the news of the new map, highlighting the benefits of dot maps and some of the job trends visible in maps of New York, San Jose, and San Francisco.
FULL STORY: Nearly every job in America, mapped in incredible detail


Friday Eye Candy: A Sorely-Needed Map of New York City Neighborhoods
Neighborhoods don't get the same official boundaries as cities, counties, states, and countries. So how do we know where one neighborhood ends and another begins?

Friday Eye Candy: The World's Subway Systems, If You Could See Them From Above
Have you ever flown over a city and imagined all the subway lines running beneath the surface?
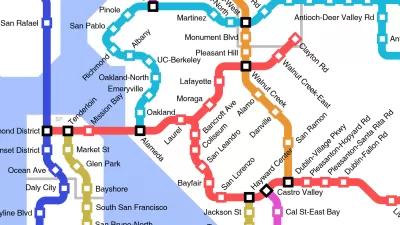
Friday Funny: Imagining Taco Bell-Oriented Rail Transit
A Reddit user created a transit map of the San Francisco Bay Area that connects Taco Bell locations, which, unlike rail public transit, have reached every corner of the region.

Trump Administration Could Effectively End Housing Voucher Program
Federal officials are eyeing major cuts to the Section 8 program that helps millions of low-income households pay rent.

Planetizen Federal Action Tracker
A weekly monitor of how Trump’s orders and actions are impacting planners and planning in America.

Ken Jennings Launches Transit Web Series
The Jeopardy champ wants you to ride public transit.

New Jersey Lawsuit Targets Rent-Setting Algorithms
The state of New Jersey is taking legal action against landlords and companies that engage in what the state’s Attorney General alleges is illegal rent fixing.

Washington Legislature Passes Rent Increase Cap
A bill that caps rent increases at 7 percent plus inflation is headed to the governor’s desk.

From Planning to Action: How LA County Is Rethinking Climate Resilience
Chief Sustainability Officer Rita Kampalath outlines the County’s shift from planning to implementation in its climate resilience efforts, emphasizing cross-departmental coordination, updated recovery strategies, and the need for flexible funding.
Urban Design for Planners 1: Software Tools
This six-course series explores essential urban design concepts using open source software and equips planners with the tools they need to participate fully in the urban design process.
Planning for Universal Design
Learn the tools for implementing Universal Design in planning regulations.
Heyer Gruel & Associates PA
Ada County Highway District
Institute for Housing and Urban Development Studies (IHS)
City of Grandview
Harvard GSD Executive Education
Toledo-Lucas County Plan Commissions
Salt Lake City
NYU Wagner Graduate School of Public Service