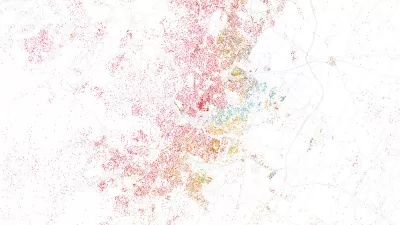
When done right, data visualization effectively translates complex data into easily understood visuals in the form of graphs, charts, maps, plots, animations, and more.

Data visualization is the representation of data through the use of common graphics, such as charts, plots, infographics, animations, and others. These displays of information are used to communicate complex data relationships and data-driven insights in a way that is easy to understand. In this article, Charles Mahler discusses seven best practices for data visualization which include:
- Have a goal in mind.
- Choose the right visualization tool.
- Choose the right type of visualization.
- Use succinct labels and titles.
- Choose the right colors.
- Avoid clutter and unnecessary elements.
- Use data that is clean and up to date.
Mahler also offers some criteria for good data visualizations. Specifically, good data visualization should:
- Show complex data connections in a way that is easy to understand, clear, concise, and clutter-free.
- Enable your audience to quickly grasp the key points you are trying to communicate.
- Effectively communicate the information and ideas in the data using the right visual elements.
- Consider the needs of various audiences, while being accessible and inclusive by using clear and legible fonts and text sizes.
- Be simple and straightforward without unnecessary elements or distractions.
- Be based on accurate, current, and reliable data.
For details, please read the source article.
FULL STORY: 7 Best Practices for Data Visualization

Alabama: Trump Terminates Settlements for Black Communities Harmed By Raw Sewage
Trump deemed the landmark civil rights agreement “illegal DEI and environmental justice policy.”

Planetizen Federal Action Tracker
A weekly monitor of how Trump’s orders and actions are impacting planners and planning in America.

The 120 Year Old Tiny Home Villages That Sheltered San Francisco’s Earthquake Refugees
More than a century ago, San Francisco mobilized to house thousands of residents displaced by the 1906 earthquake. Could their strategy offer a model for the present?

In Both Crashes and Crime, Public Transportation is Far Safer than Driving
Contrary to popular assumptions, public transportation has far lower crash and crime rates than automobile travel. For safer communities, improve and encourage transit travel.

Report: Zoning Reforms Should Complement Nashville’s Ambitious Transit Plan
Without reform, restrictive zoning codes will limit the impact of the city’s planned transit expansion and could exclude some of the residents who depend on transit the most.

Judge Orders Release of Frozen IRA, IIJA Funding
The decision is a victory for environmental groups who charged that freezing funds for critical infrastructure and disaster response programs caused “real and irreparable harm” to communities.
Urban Design for Planners 1: Software Tools
This six-course series explores essential urban design concepts using open source software and equips planners with the tools they need to participate fully in the urban design process.
Planning for Universal Design
Learn the tools for implementing Universal Design in planning regulations.
Clanton & Associates, Inc.
Jessamine County Fiscal Court
Institute for Housing and Urban Development Studies (IHS)
City of Grandview
Harvard GSD Executive Education
Toledo-Lucas County Plan Commissions
Salt Lake City
NYU Wagner Graduate School of Public Service


