


Data storytelling refers to the ability to effectively communicate insights from data using narratives and visualizations. When done right, it can be used to put data insights into context and inspire action from decisionmakers.
There is no question that our world has become increasingly data-driven. While not everyone is involved in data collection, analysis, visualization, or storytelling, we are all becoming more dependent on data to guide, inform, and justify our work. Thus, we should embrace the use of data to advance our work in the same ways that we have grown accustomed to relying on data-driven devices like smartphones, fitness trackers, and global positioning system (GPS) navigation in our daily lives.
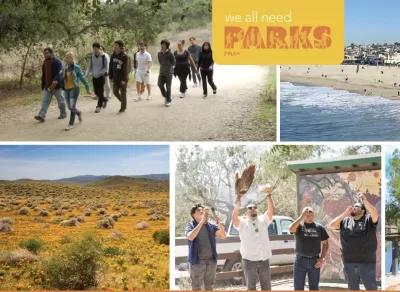
In this blog post, park planner Clement Lau explains the importance of data visualization and storytelling, with a focus on parks and recreation. For good examples of data visualization, he suggests that readers take a look at the National Recreation and Park Association (NRPA)’s Park Pulse Surveys and how the survey results are presented and summarized in infographics, charts, etc. Another example is how the Los Angeles County Department of Parks and Recreation (DPR) presents the key findings of its 2016 and 2022 Parks Needs Assessments in maps, graphs, and infographics in fact sheets, executive summaries, and final reports.
We often hear the expression that “numbers speak for themselves,” but this is not necessarily true. Lau points out that it really takes time, effort and skills to make sense of, present and communicate insights from data. For more information, please read the source article.
FULL STORY: The Importance of Data Visualization and Storytelling in Parks and Recreation

An App for California State Parks
California's Department of Parks and Recreation is getting into the app business. It is hoped that CaliParks will help improve access to the state's parks for young people and minorities.

Parklet Symposium Highlights the Success of Shared Spaces
Parklets got a boost during the Covid-19 pandemic, when the concept was translated to outdoor dining programs that offered restaurants a lifeline during the shutdown.

How Community Science Connects People, Parks, and Biodiversity
Community science engages people of all backgrounds in documenting local biodiversity, strengthening connections to nature, and contributing to global efforts like the City Nature Challenge to build a more inclusive and resilient future.

Alabama: Trump Terminates Settlements for Black Communities Harmed By Raw Sewage
Trump deemed the landmark civil rights agreement “illegal DEI and environmental justice policy.”

Study: Maui’s Plan to Convert Vacation Rentals to Long-Term Housing Could Cause Nearly $1 Billion Economic Loss
The plan would reduce visitor accommodation by 25% resulting in 1,900 jobs lost.

Planetizen Federal Action Tracker
A weekly monitor of how Trump’s orders and actions are impacting planners and planning in America.

Waymo Gets Permission to Map SF’s Market Street
If allowed to operate on the traffic-restricted street, Waymo’s autonomous taxis would have a leg up over ride-hailing competitors — and counter the city’s efforts to grow bike and pedestrian on the thoroughfare.

Parklet Symposium Highlights the Success of Shared Spaces
Parklets got a boost during the Covid-19 pandemic, when the concept was translated to outdoor dining programs that offered restaurants a lifeline during the shutdown.

Federal Homelessness Agency Places Entire Staff on Leave
The U.S. Interagency Council on Homelessness is the only federal agency dedicated to preventing and ending homelessness.
Urban Design for Planners 1: Software Tools
This six-course series explores essential urban design concepts using open source software and equips planners with the tools they need to participate fully in the urban design process.
Planning for Universal Design
Learn the tools for implementing Universal Design in planning regulations.
Caltrans
Smith Gee Studio
Institute for Housing and Urban Development Studies (IHS)
City of Grandview
Harvard GSD Executive Education
Toledo-Lucas County Plan Commissions
Salt Lake City
NYU Wagner Graduate School of Public Service