


What comparing 25 years of urban expansion on six continents reveals about the changing nature of the built environment.
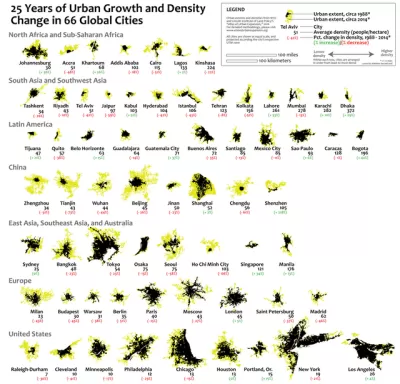
The Vivid Maps website shares the mapping work of Reddit user mappermatt, who recently created a visualization of sprawl using data from the 2016 Atlas of Urban Expansion, created by New York University and the Lincoln Institute of Land Policy.
The map traces the "urban extents" of 66 cities over a period of 25 years. The cities are shown at the same scale to allow for easy comparison, but also going beyond administrative boundaries. Instead, the maps represent the "contiguous built-up urbanized area of each city’s respective metropolitan region," according to the article.
The Vivid Maps article also provides insight into what the maps make apparent, such as the kinds of growth in some cities, the relative lack of growth in others, and what the map reveals about the changing density of these cities. The map's revelations about density, according to the article, reveal some of its most interesting takeaways.
FULL STORY: 25 Years of Urban Growth and Density Change in 66 Global Cities

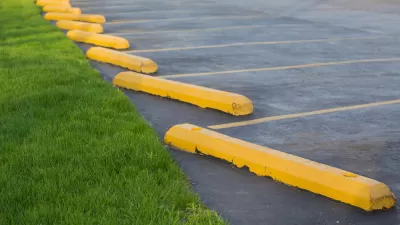
Maps: How Much of Your City is Parking?
The percentage of land dedicated to parking in the central districts of major U.S. cities ranges from 4 percent to as much as 42 percent.

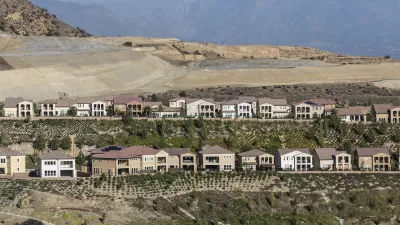
Florida Law Would Change the Definition of ‘Sprawl’
One quick way to build sprawl.
YIMBYs and Environmentalists Team Up at Last
The politics of development in California achieved another significant milestone recently, when a YIMBY organization and an environmental advocacy organization collaborated on new land use legislation to be considered by the State Legislature.

Alabama: Trump Terminates Settlements for Black Communities Harmed By Raw Sewage
Trump deemed the landmark civil rights agreement “illegal DEI and environmental justice policy.”

Planetizen Federal Action Tracker
A weekly monitor of how Trump’s orders and actions are impacting planners and planning in America.

The 120 Year Old Tiny Home Villages That Sheltered San Francisco’s Earthquake Refugees
More than a century ago, San Francisco mobilized to house thousands of residents displaced by the 1906 earthquake. Could their strategy offer a model for the present?

In Both Crashes and Crime, Public Transportation is Far Safer than Driving
Contrary to popular assumptions, public transportation has far lower crash and crime rates than automobile travel. For safer communities, improve and encourage transit travel.

Report: Zoning Reforms Should Complement Nashville’s Ambitious Transit Plan
Without reform, restrictive zoning codes will limit the impact of the city’s planned transit expansion and could exclude some of the residents who depend on transit the most.

Judge Orders Release of Frozen IRA, IIJA Funding
The decision is a victory for environmental groups who charged that freezing funds for critical infrastructure and disaster response programs caused “real and irreparable harm” to communities.
Urban Design for Planners 1: Software Tools
This six-course series explores essential urban design concepts using open source software and equips planners with the tools they need to participate fully in the urban design process.
Planning for Universal Design
Learn the tools for implementing Universal Design in planning regulations.
Clanton & Associates, Inc.
Jessamine County Fiscal Court
Institute for Housing and Urban Development Studies (IHS)
City of Grandview
Harvard GSD Executive Education
Toledo-Lucas County Plan Commissions
Salt Lake City
NYU Wagner Graduate School of Public Service