


Good news for the United States is found in a recent series of maps by NASA. Air pollution has significantly improved around the country.
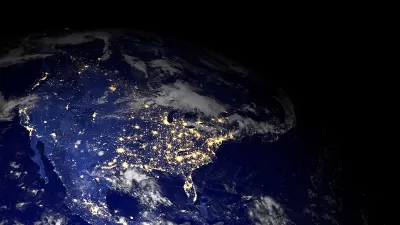
Rick Noack shares the news: "NASA scientists created a series of maps that show the "human fingerprint on global air quality." The images offer insights into air pollution in nearly 200 cities around the world, as well as in neighboring areas."
"To illustrate to what extent pollution has increased or decreased, the NASA researchers measured concentrations between 2005 and 2014. Blue areas indicate a decrease in pollution; orange indicates an increase," adds Noack.
Noack notes the good news: "the scientists concluded that the United States, Europe and Japan have greatly improved their air quality." The bad news, however: "pollution has worsened in parts of China, India and the Middle East."


Average nitrogen dioxide concentrations across the United States in 2014. (Map created by NASA's Goddard Space Flight Center)

The trend map showing the decreases in nitrogen dioxide concentrations from 2005 to 2014. (Map created by NASA's Goddard Space Flight Center)
A detailed post on NASA also explains the study and the mapping exercise.
FULL STORY: This world map shows where pollution is getting worse. There’s good news for the U.S.


Wisconsin Republicans Block Congestion, Pollution Funds From Bike and Ped Projects
It was always a risk that states would use funding from the federal Infrastructure Investment and Jobs Act to double down on the transportation systems that create congestion and air pollution.
The Trump Administration's Environmental Policies Have Consequences for Black Lives
A Trump administration decision not to tighten Clean Air Act restrictions on soot pollution will have more consequences for Black Americans.
As Coronavirus Spreads, Air Pollution Plummets
More people are driving less and staying at home. The result is significant improvements in air quality in cities across the country.

Trump Administration Could Effectively End Housing Voucher Program
Federal officials are eyeing major cuts to the Section 8 program that helps millions of low-income households pay rent.

Planetizen Federal Action Tracker
A weekly monitor of how Trump’s orders and actions are impacting planners and planning in America.

Ken Jennings Launches Transit Web Series
The Jeopardy champ wants you to ride public transit.

Rebuilding Smarter: How LA County Is Guiding Fire-Ravaged Communities Toward Resilience
Los Angeles County is leading a coordinated effort to help fire-impacted communities rebuild with resilience by providing recovery resources, promoting fire-wise design, and aligning reconstruction with broader sustainability and climate goals.

When Borders Blur: Regional Collaboration in Action
As regional challenges outgrow city boundaries, “When Borders Blur” explores how cross-jurisdictional collaboration can drive smarter, more resilient urban planning, sharing real-world lessons from thriving partnerships across North America.

Philadelphia Is Expanding its Network of Roundabouts
Roundabouts are widely shown to decrease traffic speed, reduce congestion, and improve efficiency.
Urban Design for Planners 1: Software Tools
This six-course series explores essential urban design concepts using open source software and equips planners with the tools they need to participate fully in the urban design process.
Planning for Universal Design
Learn the tools for implementing Universal Design in planning regulations.
Ada County Highway District
Clanton & Associates, Inc.
Jessamine County Fiscal Court
Institute for Housing and Urban Development Studies (IHS)
City of Grandview
Harvard GSD Executive Education
Toledo-Lucas County Plan Commissions
Salt Lake City
NYU Wagner Graduate School of Public Service