


Many studies have measured and compared the sprawl of U.S. metropolitan areas. A recent study tracks the rate at which the same cities grew either less compact or more compact for the decade between 2000 and 2010.
Eric Jaffe shares the details of a new report by Reid Ewing and Shima Hamidi of the University of Utah that tracks the rate of sprawl for the largest 162 urbanized areas in the United States. According to Jaffe's telling, "Ewing and Hamidi scored the largest 162 U.S. urbanized areas on the Sprawl Index — or, if you're feeling optimistic, the Compactness Index — for 2010. (Urbanized areas reflect development better than fixed metro area boundaries do.) Then they applied the index to the same cities in 2000 to show the change over time."
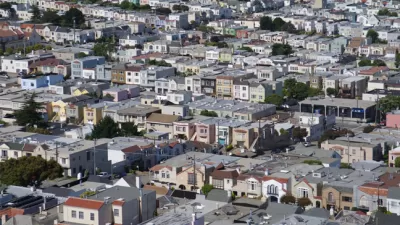
Jaffe's coverage of the study includes maps and, most helpfully, graphs, which quantifies the rate of sprawl for urban areas around the country. The data reveals for instance, that the country's most compact area, San Francisco-Oakland, actually became less compact between 2000 and 2010. At the other end of the spectrum, the least compact city, Atlanta, became less compact still.
The article concludes by describing the possible policy implications of the study.
FULL STORY: The U.S. Cities That Sprawled the Most (and Least) Between 2000 and 2010

SPUR: The Bay Area Has A Sprawl Problem
SPUR states its case clearly by announcing, “We believe cities are the key to our future” at the opening of a new report called “SPUR’s Agenda for Change.”
A Detailed History of Atlanta's 'War on Density'
The Atlanta Studies website takes a deep dive into the history that produced the city of Atlanta as we know it today—and provides some suggestions on how to "correct some of its most atrocious attacks on the urban built environment."

Where Los Angeles Equals San Francisco's Density
Though the Los Angeles region is very dense, significant barriers to transit-oriented planning remain. Based on this analysis, the lack of a central urban core shouldn't be one of them.

Alabama: Trump Terminates Settlements for Black Communities Harmed By Raw Sewage
Trump deemed the landmark civil rights agreement “illegal DEI and environmental justice policy.”

Planetizen Federal Action Tracker
A weekly monitor of how Trump’s orders and actions are impacting planners and planning in America.

The 120 Year Old Tiny Home Villages That Sheltered San Francisco’s Earthquake Refugees
More than a century ago, San Francisco mobilized to house thousands of residents displaced by the 1906 earthquake. Could their strategy offer a model for the present?

In Both Crashes and Crime, Public Transportation is Far Safer than Driving
Contrary to popular assumptions, public transportation has far lower crash and crime rates than automobile travel. For safer communities, improve and encourage transit travel.

Report: Zoning Reforms Should Complement Nashville’s Ambitious Transit Plan
Without reform, restrictive zoning codes will limit the impact of the city’s planned transit expansion and could exclude some of the residents who depend on transit the most.

Judge Orders Release of Frozen IRA, IIJA Funding
The decision is a victory for environmental groups who charged that freezing funds for critical infrastructure and disaster response programs caused “real and irreparable harm” to communities.
Urban Design for Planners 1: Software Tools
This six-course series explores essential urban design concepts using open source software and equips planners with the tools they need to participate fully in the urban design process.
Planning for Universal Design
Learn the tools for implementing Universal Design in planning regulations.
Clanton & Associates, Inc.
Jessamine County Fiscal Court
Institute for Housing and Urban Development Studies (IHS)
City of Grandview
Harvard GSD Executive Education
Toledo-Lucas County Plan Commissions
Salt Lake City
NYU Wagner Graduate School of Public Service