


A new animated map presents the reported cases of potholes in Chicago since November—the maps colorful and provides insights into how the city, and our relationship to it, can change with time.
Vikki Ortiz Healy reports for the Chicago Tribune about a new animated map of pothole reports from November to this week in the city of Chicago. To create the map, Elliott Ramos downloaded data from the city of Chicago’s website, “which meticulously documents all pothole reports.”
The map blinks like a Christmas tree as the number and density of reported potholes expands and contracts with time. January through February, for instance, might require sunglasses for viewing given the density of reported potholes.
According to Healy’s article, Ramos created the visualization to help residents understand the nuances of how data manifests around the city. “At a wide glance, Ramos’ map, which took him less than an hour to create, shows an orange dot for each pothole report. The orange fades to yellow/pink as time elapses. The point, he said, is to demonstrate how the number of pothole reports changes over time, and that there can be days with a surge of reportings — such as just after Jan. 1 or at Jan. 15 — perhaps when more people are home to notice or are inspired by media reports,” writes Healy.
FULL STORY: Where are the most pot holes in the city? There's an app for that.

A Central Hub for Open Data
Designed by researchers at the University of Chicago, the Plenario platform gathers all available open data for a specific area. Then it presents the data in an easy-to-use format.
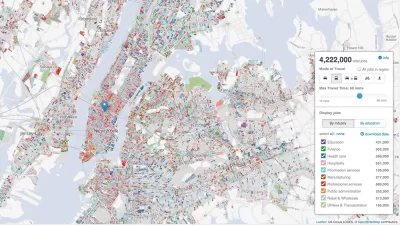
The Growing Importance of Location Intelligence
Location intelligence is transforming decision-making, with an increasing number and type of organizations modernizing operations with a geographic approach to problem-solving, planning, and prediction.
Real-Time Art Installation Reveals the Many Dimensions of Data
Using a wagon filled with phones, an artist in Berlin demonstrated the disconnect between data and the real world.

Alabama: Trump Terminates Settlements for Black Communities Harmed By Raw Sewage
Trump deemed the landmark civil rights agreement “illegal DEI and environmental justice policy.”

Study: Maui’s Plan to Convert Vacation Rentals to Long-Term Housing Could Cause Nearly $1 Billion Economic Loss
The plan would reduce visitor accommodation by 25% resulting in 1,900 jobs lost.

Planetizen Federal Action Tracker
A weekly monitor of how Trump’s orders and actions are impacting planners and planning in America.

Wind Energy on the Rise Despite Federal Policy Reversal
The Trump administration is revoking federal support for renewable energy, but demand for new projects continues unabated.

Passengers Flock to Caltrain After Electrification
The new electric trains are running faster and more reliably, leading to strong ridership growth on the Bay Area rail system.

Texas Churches Rally Behind ‘Yes in God’s Back Yard’ Legislation
Religious leaders want the state to reduce zoning regulations to streamline leasing church-owned land to housing developers.
Urban Design for Planners 1: Software Tools
This six-course series explores essential urban design concepts using open source software and equips planners with the tools they need to participate fully in the urban design process.
Planning for Universal Design
Learn the tools for implementing Universal Design in planning regulations.
Caltrans
Smith Gee Studio
Institute for Housing and Urban Development Studies (IHS)
City of Grandview
Harvard GSD Executive Education
Toledo-Lucas County Plan Commissions
Salt Lake City
NYU Wagner Graduate School of Public Service