


New tools are becoming available to help people evaluate the quality of walking, cycling, public transit and automobile accessibility when making home location decisions. This information can help create more efficient and sustainable communities.


The old transportation planning paradigm was automobile-oriented: it assumed that “transportation” means automobile travel, and so evaluated transportation system performance based on the speed and convenience of driving. The new paradigm is multi-modal: it recognizes the important and unique roles that walking, cycling and public transportation play in an efficient and equitable transportation system, and so evaluates transportation system performance based on multi-modal performance indicators.
Consumers are experiencing a similar paradigm shift: households increasingly recognize the value of living in a neighborhood that offers good walking, cycling and public transit accessibility, in addition to automobile access. As Emerging Trends in Real Estate explains,
Energy prices and road congestion accelerate the move back into metropolitan-area interiors as more people crave greater convenience in their lives. They want to live closer to work and shopping without the hassle of car dependence. Higher-density residential projects with retail components will gain favor in the next round of building. Apartment and townhouse living looks more attractive, especially to singles and empty nesters—high utility bills, gasoline expenses, car payments, and rising property taxes make suburban-edge McMansion lifestyles decidedly less economical.
One of the most effective ways that we can help improve transportation system efficiency and create more sustainable communities is to provide multi-modal accessibility information to households when they are choosing a home to rent or purchase, so they can better understand these factors.
Several organizations have recently developed tools to help home-buyers optimize home locations based on accessibility and related costs. For example, various Google Maps applications can produce maps that show commute travel times for particular locations. WalkScore, BikeScore and Transit Score indicate accessibility by these modes, measured as the number of destinations that can be reached within a given travel time for a particular location.
This information can be presented in various ways, including modal accessibility ratings from zero to 100 for a particular address, heat maps which show modal accessibility for specific urban neighborhoods, and guidance for finding rentable apartments with particular accessibility features, such as acceptable commute travel times to a particular worksite by various modes.

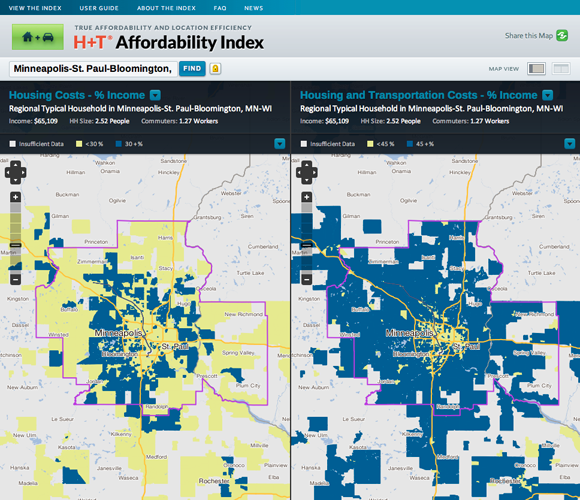
The Housing + Transportation Index indicates the combined housing and transportation costs of a particular location, and therefore helps households make trade-offs between these costs, for example, between an urban-fringe location that has cheaper housing but higher transport costs and a more central location that has higher housing but lower transport costs.
These tools are multi-modal. In contrast, the INRIX corporation sells traffic congestion information so its new real estate evaluation tool only indicates automobile commute travel times and delay. This reflects the old planning paradigm, which assumes that “transportation” means driving, and “transportation problem” means traffic delay. The INRIX data is not bad, it is slightly more precise than other systems for predicting automobile travel times since it is based on their traffic data collection system, but it is important to recognize its limitations: it indicates nothing about other modes or costs, and so is a poor indication of overall accessibility or affordability.
Neighborhood Scout and Walkscore Neighborhoods provide information on other local conditions including crime, public school quality and past real estate value appreciation. Neighborhood Scout measures crime rates per square mile, which is pretty silly and inherently anti-urban because it implies, incorrectly, that denser areas are more dangerous. Walkscore Neighborhoods measures crime rates per capita, which is more accurate, but still fails to account for other factors such as land use mix (some types of crime are more common in commercial areas, so more mixed neighborhoods will seem to have higher crime rates than residential-only neighborhoods), and so is still somewhat anti-urban.
Home location decisions have significant impacts: more accessible and multi-modal home locations can provide direct savings and benefits to households, and indirect benefits to the larger community. New tools can help households understand and optimize these decisions. I hope that we will see expanded use of more comprehensive and multi-modal location optimization guidance systems.
For More Information
CNT (2013), The New Real Estate Mantra: Location Near Public Transportation, Center for Neighborhood Technology, American Public Transportation Association, National Association of Realtors.
Reid Ewing, Keith Bartholomew, Steve Winkelman, Jerry Walters and Don Chen (2007), Growing Cooler: The Evidence on Urban Development and Climate Change, Urban Land Institute and Smart Growth America.
Reid Ewing (2007), “The Demand For Smart Growth: What Survey Research Tell Us,” Planning, American Planning Association.
Louise Keely, Bart van Ark, Gad Levanon and Jeremy Burbank (2012), The Shifting Nature of U.S. Housing Demand, The Demand Institute.
Todd Litman (2010), Affordable-Accessible Housing In A Dynamic City: Why and How To Support Development of More Affordable Housing In Accessible Locations, Victoria Transport Policy Institute.
Todd Litman (2012), Where We Want To Be: Home Location Preferences And Their Implications For Smart Growth, Victoria Transport Policy Institute.
Raven Molloy and Hui Shan (2011), The Effect of Gasoline Prices on Household Location, Federal Reserve Board.
MTC (2010), Choosing Where We Live: Attracting Residents to Transit-Oriented Neighborhoods in the San Francisco Bay Area; Briefing Book for City Planners and Managers, Metropolitan Transportation Commission.
NAR (2011), 2011 Community Preference Survey: What Americans Are Looking For When Deciding Where To Live, National Association of Realtors.
Arthur C. Nelson (2006), “Leadership in a New Era,” Journal of the American Planning Association, Vol. 72, No. 4.
USEPA (2011), Market Acceptance of Smart Growth, U.S. Environmental Protection Agency.

Carfree Design Manual
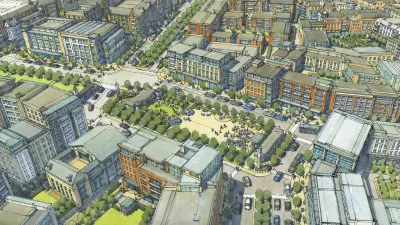
As planners, one of our roles is to help stretch the scope of what is considered possible. For example, between 1950 and 2000 most development was highly automobile-dependent, based on the assumption that almost all travel would be by personal automobile and other modes were relatively unimportant. This pattern is so well established that many people have difficulty imagining anything different. It is useful to help people understand the full range of options available, from automobile dependency to carfree communities.
700-Acre Master-Planned Community Planned in Utah
A massive development plan is taking shape for lakefront property in Vineyard, Utah—on the site of a former U.S. Steel Geneva Works facility.

Parking Requirements Removed Near Cleveland Transit Stops
Transit oriented parking reform has arrived in Cleveland.

Alabama: Trump Terminates Settlements for Black Communities Harmed By Raw Sewage
Trump deemed the landmark civil rights agreement “illegal DEI and environmental justice policy.”

Planetizen Federal Action Tracker
A weekly monitor of how Trump’s orders and actions are impacting planners and planning in America.

The 120 Year Old Tiny Home Villages That Sheltered San Francisco’s Earthquake Refugees
More than a century ago, San Francisco mobilized to house thousands of residents displaced by the 1906 earthquake. Could their strategy offer a model for the present?

Ken Jennings Launches Transit Web Series
The Jeopardy champ wants you to ride public transit.

BLM To Rescind Public Lands Rule
The change will downgrade conservation, once again putting federal land at risk for mining and other extractive uses.

Indy Neighborhood Group Builds Temporary Multi-Use Path
Community members, aided in part by funding from the city, repurposed a vehicle lane to create a protected bike and pedestrian path for the summer season.
Urban Design for Planners 1: Software Tools
This six-course series explores essential urban design concepts using open source software and equips planners with the tools they need to participate fully in the urban design process.
Planning for Universal Design
Learn the tools for implementing Universal Design in planning regulations.
Clanton & Associates, Inc.
Jessamine County Fiscal Court
Institute for Housing and Urban Development Studies (IHS)
City of Grandview
Harvard GSD Executive Education
Toledo-Lucas County Plan Commissions
Salt Lake City
NYU Wagner Graduate School of Public Service