


Want an easy to use public engagement tool that helps you to understand the visual preferences of the public? StreetSeen (http://streetseen.osu.edu), a free online tool allows planners and others to simply construct and deploy visual surveys.

Most of us have been to public meetings where we have heard members of the public express what might seem to be extreme views, expressing for example that adding sidewalks to their neighborhood will bring more crime. Or you may hear people say I wish our city was more like city _______! But what is it about that place that people find appealing. And if showed a series of images of their own city and the other city how often would people pick images of the other city?
The challenge for planners and others involved in public engagement is that creating visual surveys is time consuming. Someone has to drive around to get these pictures and if you are comparing two different places then you have to find images of the other city. While internet images can be helpful, they aren’t always taken from the angle you might want and it is difficult to find comparable images.
What tools can us as planners in understanding what is most important to citizens? Public meetings help, but often only lead to a surface level understanding of preferences. I wanted to create an easy to use engagement tool that would allow us to look into the minds of our citizens to understand what it is they are thinking when they say they would prefer X, Y, or Z. The idea for StreetSeen came from observation of Beautiful Streets and PlacePulse. Both of these open tools use Google Streetview for survey purposes. It is a very simple and elegent idea. Simply show people two images of real places, pulling images from Google Streetview, and ask them to vote on which they would prefer.

StreetSeen hopes to quantitatively understand different perceptions of streets. Most of us experience our cities along its streets. We walk along the sidewalks, bicycle or drive along the streets and ultimately explore our cities via these transportation networks.
Google Street View allows people to explore places across the world through 360-degree street-level images. Google Street View provides a great opportunity to study and understand our cities. StreetSeen extends Google Street View in order to allow planners to experiment in evaluating cities.
Many planners have used visual preference surveys to see what people think about different places. Visual preferences surveys, originated by Anton Tony Nelessen in the 1970s, typically ask participants to view a series of images and score them based on their preference. The best visual preference surveys are precise in what they are seeking to measure. For example, making sure that all of the images are viewed from the same angle. But it is very time consuming to go out and take pictures and put them together into a visual preference survey.
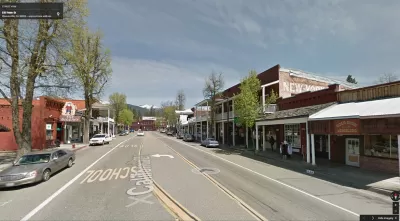
The great thing about Google Street View is that the images are 360 degrees making it simple to rotate images to achieve a particular perspective. These are realistic images of what cities are really like. They aren’t doctored fancy pictures. These are quite similar to what you would see if you were exploring your city by car, bike, or foot.
While showing two images side by side and asking users to pick an image seems like a very simple task for members of the public. But the simplicity of the task the citizen is engaging in tackles a highly complex set of decisions factors and helps the planner to more easily understand the interaction of these attributes. For example, I along with my colleague Professor Gulsah Akar wanted to understand the factors that lead to a street being considered bikable. Our StreetSeen survey asked a very simple question "Which street would you prefer to ride a bicyle on?" We were able to test for 14 attributes with 53 different conditions. For example, considering different land uses, number of travel lanes, and type of on street parking. The full results of this study are publicly available. Users have found many different types of applications for this tool in their public engagement work. For example, one user, has asked the question “As a tourist, which place would you prefer to explore” and another user created a survey asking the question “Which place looks more friendly for pushing a baby stroller”. This tool can be used to engage the public in any type of planning process where one wants to ask about visual places in our communities. Right now, myself along with my colleague Gulsah Akar, are studying what aspects of a street make it most desired for walking.
Being able to analyze the results of the survey is key. Included in the tool is a simple analysis that shows which images were most favored. Users also have the option to download their data in a CSV or XLS format. This allows the user to undertake more sophisticated analysis on their own. All of the results are geocoded, allowing the planner to know the location of the voter and the location of the individual image shown. This allows for integration with GIS, scenario planning and other place based tools.
This innovation provides a mechanism to engage the public in understanding the tradeoffs among various attributes in a clean, quantitative framework. It provides a virtually limitless number of images based on a limitless set of attribute data that can be collected from snapshot streetview images. This vastly simplifies the process for planners who want to understand these tradeoffs and use this knowledge to build better, more usable cities. I hope that you will find this a useful tool in your own planning work.


How Cities Can Leverage Financial Data for Smarter Urban Planning
Explore how cities can use financial data to enhance urban planning, improve budget allocation, and boost community services.
The Growing Importance of Data Storytelling
Data storytelling refers to the ability to effectively communicate insights from data using narratives and visualizations. When done right, it can be used to put data insights into context and inspire action from decisionmakers.

The Importance of Good Data Visualization
When done right, data visualization effectively translates complex data into easily understood visuals in the form of graphs, charts, maps, plots, animations, and more.

Alabama: Trump Terminates Settlements for Black Communities Harmed By Raw Sewage
Trump deemed the landmark civil rights agreement “illegal DEI and environmental justice policy.”

Study: Maui’s Plan to Convert Vacation Rentals to Long-Term Housing Could Cause Nearly $1 Billion Economic Loss
The plan would reduce visitor accommodation by 25% resulting in 1,900 jobs lost.

Why Should We Subsidize Public Transportation?
Many public transit agencies face financial stress due to rising costs, declining fare revenue, and declining subsidies. Transit advocates must provide a strong business case for increasing public transit funding.

Paris Bike Boom Leads to Steep Drop in Air Pollution
The French city’s air quality has improved dramatically in the past 20 years, coinciding with a growth in cycling.

Why Housing Costs More to Build in California Than in Texas
Hard costs like labor and materials combined with ‘soft’ costs such as permitting make building in the San Francisco Bay Area almost three times as costly as in Texas cities.

San Diego County Sees a Rise in Urban Coyotes
San Diego County experiences a rise in urban coyotes, as sightings become prevalent throughout its urban neighbourhoods and surrounding areas.
Urban Design for Planners 1: Software Tools
This six-course series explores essential urban design concepts using open source software and equips planners with the tools they need to participate fully in the urban design process.
Planning for Universal Design
Learn the tools for implementing Universal Design in planning regulations.
Smith Gee Studio
Alamo Area Metropolitan Planning Organization
City of Santa Clarita
Institute for Housing and Urban Development Studies (IHS)
City of Grandview
Harvard GSD Executive Education
Toledo-Lucas County Plan Commissions
Salt Lake City
NYU Wagner Graduate School of Public Service