


This performance ranking separates the fakers from the legit operation to reduce carbon emissions from transportation.
Streetlight Data released its "2020 U.S. Transportation Climate Impact Index," which ranks the 100 largest metropolitan areas on climate impact using performance-based transportation metrics.
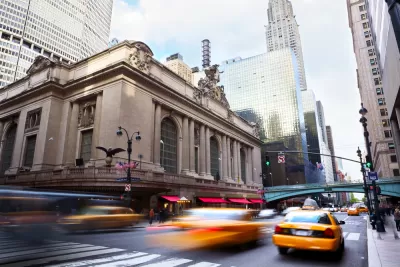
As explained in an article that introduces the index, the rankings boil down to the difference between car travel and low-carbon alternative modes of travel. Thus, the number one metropolitan area probably won't come as a surprise: New York City-Newark-Jersey City. Coming in second is San Francisco-Oakland-Hayward, and coming in third is Madison, Wisconsin.
Streetlight Data released a package of data and articles to help offer insight into the details of the index beyond the rankings. So the entire list of metropolitan areas and rankings by key metrics in the index are also available.
The decline of the coal industry in recent years has pushed transportation to the top of the list as the largest emitter of greenhouse gas by sector. Streetlight Data puts a finer point on the origins of that leading source of greenhouse gases.
FULL STORY: 2020 U.S. Transportation Climate Impact Index

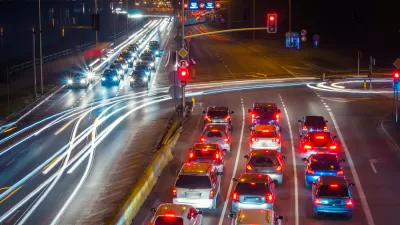
Where the Pandemic Has Scrambled Traffic Patterns
The map of metropolitan areas that drive least, and thus emit fewer greenhouse gas emissions, has been completely redrawn by the pandemic, according to a recent report.
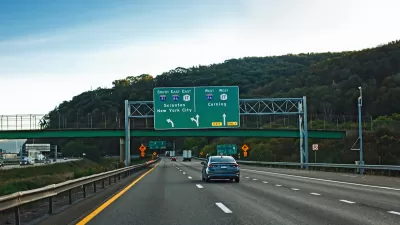
Proposed New York Bill Would Align Transportation Projects With Driving Reduction Goals
If passed, the law would require all highway projects to show how they would reduce VMT or mitigate their impact.
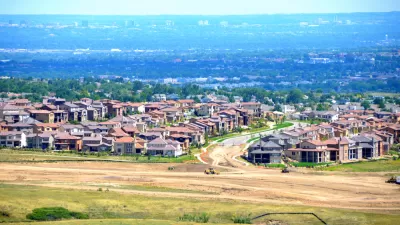
Connecting Land Use and Transportation Planning to Save the Climate
The United States will have to make major changes to long-standing land use and transportation paradigms to prevent the worst outcomes of climate change. How to make those changes was the subject of a recent podcast.

Trump Administration Could Effectively End Housing Voucher Program
Federal officials are eyeing major cuts to the Section 8 program that helps millions of low-income households pay rent.

Planetizen Federal Action Tracker
A weekly monitor of how Trump’s orders and actions are impacting planners and planning in America.

Ken Jennings Launches Transit Web Series
The Jeopardy champ wants you to ride public transit.

When Borders Blur: Regional Collaboration in Action
As regional challenges outgrow city boundaries, “When Borders Blur” explores how cross-jurisdictional collaboration can drive smarter, more resilient urban planning, sharing real-world lessons from thriving partnerships across North America.

Philadelphia Is Expanding its Network of Roundabouts
Roundabouts are widely shown to decrease traffic speed, reduce congestion, and improve efficiency.

Why Bike Lanes Are Good: An Explainer for the US Transportation Secretary
Sean Duffy says there’s no evidence that bike lanes have benefits. Streetsblog — and federal agencies’ own data — beg to differ.
Urban Design for Planners 1: Software Tools
This six-course series explores essential urban design concepts using open source software and equips planners with the tools they need to participate fully in the urban design process.
Planning for Universal Design
Learn the tools for implementing Universal Design in planning regulations.
Ada County Highway District
Clanton & Associates, Inc.
Jessamine County Fiscal Court
Institute for Housing and Urban Development Studies (IHS)
City of Grandview
Harvard GSD Executive Education
Toledo-Lucas County Plan Commissions
Salt Lake City
NYU Wagner Graduate School of Public Service