


The roads in your city might conform to a grid, or they might divert around natural resources or landmarks. A new tool aims to help you visualize the "hidden logic" behind urban growth.
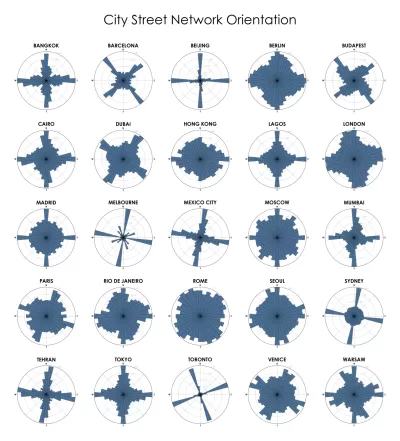
"It works by using an old geography technique: the 'polar' or circular chart. Boeing's tool calculates what percentage of a city's roads run along each section of a compass, and plots it on a circular bar chart."
Because the majority of streets in Manhattan, for example, align along a grid, its network is primarily encompassed in four long bars radiating out from the center of the circle. A few shorter bars represent the smaller portion of streets that don't line up.
Montgomery notes that a similar concept was created recently by data scientist Seth Kadish, but Boeing's adaptation made the model usable by anyone with knowledge of the programming language Python. Developer Vladimir Agafonkin built on Boeing's work to build a version for web browsers, so that "anyone can use a typical web mapping interface to visit any city or other region in the world and see a polar chart of its street grid."
"'It's a wonderful way to explore how cities are built; understand their hidden patterns and influences,' said Agafonkin. 'You can see where a road network was meticulously planned and where it grew naturally. [You can] see subtle connections like terrain, water bodies and nearby attractions influencing the direction of roads.'"
FULL STORY: Visualizing the Hidden ‘Logic’ of Cities

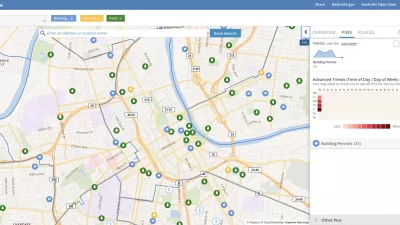
Presenting Municipal Data in an Interactive Map, Nashville Style
The city of Nashville launched the NashView interactive data map earlier this month.

Metrorail Travel Patterns Revealed
Commute data for one of the nation's premier rail transit systems, revealed.

How the National Park Service Uses GIS
A new book demonstrates how the National Park Service uses GIS technology to meet its mission and showcases a selection of maps used for effectively managing national parks.

Alabama: Trump Terminates Settlements for Black Communities Harmed By Raw Sewage
Trump deemed the landmark civil rights agreement “illegal DEI and environmental justice policy.”

Study: Maui’s Plan to Convert Vacation Rentals to Long-Term Housing Could Cause Nearly $1 Billion Economic Loss
The plan would reduce visitor accommodation by 25% resulting in 1,900 jobs lost.

Planetizen Federal Action Tracker
A weekly monitor of how Trump’s orders and actions are impacting planners and planning in America.

Baltimore Ordered to Improve Sidewalk Accessibility
The city is one of many to face lawsuits for failing to comply with the Americans with Disabilities Act.

This Toronto Suburb Has More Bus Riders Than Columbus, Ohio
Brampton, Ontario used gradual improvements in service to prove that if you build it, they will ride.

Paris Bike Boom Leads to Steep Drop in Air Pollution
The French city’s air quality has improved dramatically in the past 20 years, coinciding with a growth in cycling.
Urban Design for Planners 1: Software Tools
This six-course series explores essential urban design concepts using open source software and equips planners with the tools they need to participate fully in the urban design process.
Planning for Universal Design
Learn the tools for implementing Universal Design in planning regulations.
Smith Gee Studio
Alamo Area Metropolitan Planning Organization
City of Santa Clarita
Institute for Housing and Urban Development Studies (IHS)
City of Grandview
Harvard GSD Executive Education
Toledo-Lucas County Plan Commissions
Salt Lake City
NYU Wagner Graduate School of Public Service