


What comparing 25 years of urban expansion on six continents reveals about the changing nature of the built environment.
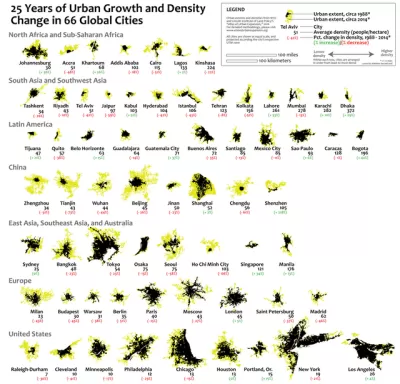
The Vivid Maps website shares the mapping work of Reddit user mappermatt, who recently created a visualization of sprawl using data from the 2016 Atlas of Urban Expansion, created by New York University and the Lincoln Institute of Land Policy.
The map traces the "urban extents" of 66 cities over a period of 25 years. The cities are shown at the same scale to allow for easy comparison, but also going beyond administrative boundaries. Instead, the maps represent the "contiguous built-up urbanized area of each city’s respective metropolitan region," according to the article.
The Vivid Maps article also provides insight into what the maps make apparent, such as the kinds of growth in some cities, the relative lack of growth in others, and what the map reveals about the changing density of these cities. The map's revelations about density, according to the article, reveal some of its most interesting takeaways.
FULL STORY: 25 Years of Urban Growth and Density Change in 66 Global Cities


Maps: How Much of Your City is Parking?
The percentage of land dedicated to parking in the central districts of major U.S. cities ranges from 4 percent to as much as 42 percent.

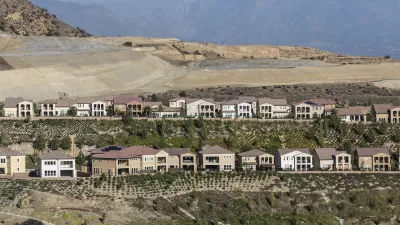
Florida Law Would Change the Definition of ‘Sprawl’
One quick way to build sprawl.
YIMBYs and Environmentalists Team Up at Last
The politics of development in California achieved another significant milestone recently, when a YIMBY organization and an environmental advocacy organization collaborated on new land use legislation to be considered by the State Legislature.

Alabama: Trump Terminates Settlements for Black Communities Harmed By Raw Sewage
Trump deemed the landmark civil rights agreement “illegal DEI and environmental justice policy.”

Study: Maui’s Plan to Convert Vacation Rentals to Long-Term Housing Could Cause Nearly $1 Billion Economic Loss
The plan would reduce visitor accommodation by 25% resulting in 1,900 jobs lost.

Planetizen Federal Action Tracker
A weekly monitor of how Trump’s orders and actions are impacting planners and planning in America.

Wind Energy on the Rise Despite Federal Policy Reversal
The Trump administration is revoking federal support for renewable energy, but demand for new projects continues unabated.

Passengers Flock to Caltrain After Electrification
The new electric trains are running faster and more reliably, leading to strong ridership growth on the Bay Area rail system.

Texas Churches Rally Behind ‘Yes in God’s Back Yard’ Legislation
Religious leaders want the state to reduce zoning regulations to streamline leasing church-owned land to housing developers.
Urban Design for Planners 1: Software Tools
This six-course series explores essential urban design concepts using open source software and equips planners with the tools they need to participate fully in the urban design process.
Planning for Universal Design
Learn the tools for implementing Universal Design in planning regulations.
Caltrans
Smith Gee Studio
Institute for Housing and Urban Development Studies (IHS)
City of Grandview
Harvard GSD Executive Education
Toledo-Lucas County Plan Commissions
Salt Lake City
NYU Wagner Graduate School of Public Service