


The Urban Mobility Report (UMR) evaluates traffic congestion problems and recommends congestion reduction solutions. How well does it reflect travelers' priorities?

In college we learned to evaluate literature critically. The key is skepticism. Don't simply trust the author's words, look for their biases, omissions, contradictions, and lies. A good research document does not simply tell readers what to think, it gives readers the information they need to reach their own conclusions. This requires:
- A well-defined research question.
- A review of related research.
- Presentation of evidence, with data and analysis in a format that can be replicated by others.
- Discussion of critical assumptions, contrary findings, and alternative interpretations.
- Cautious conclusions and discussion of their implications.
- Adequate references, including alternative perspectives and criticism.
- Independent peer review.
This is a good time to critically reexamine transportation planning documents. Transportation planning is undergoing a paradigm shift that is changing the way we define problems and evaluate potential solutions. The old paradigm was mobility-based, which assumed that our goal is simply to maximize travel speeds. A new paradigm is more comprehensive and multimodal. It considers other goals and impacts, such as comfort, affordability, social equity, public health, community livability and environmental quality. The table below compares the old and new paradigms.
Changing Transport Planning Paradigm
|
Old Paradigm |
New Paradigm |
|
|
Definition of Transportation |
Mobility (physical travel), mainly automobile travel. |
Accessibility (people’s overall ability to reach services and activities). |
|
Modes considered |
Mainly automobile. |
Multi-modal: Walking, cycling, public transport, automobile, telework and delivery services. |
|
Objectives |
Maximize vehicle travel speeds, minimize traffic delay; minimize vehicle operating costs; minimize per-mile crash rates. |
Maximize travel speeds; road and parking cost efficiency; consumer savings and affordability; accessibility for non-drivers; public health and safety; energy conservation and emission reductions; efficient land use (reduced sprawl). |
|
Impacts considered |
Travel speeds and delay, vehicle operating costs and fares, crash and emission rates. |
Various economic, social and environmental impacts, including indirect impacts. |
|
Favored transport improvement options |
Roadway capacity expansion. |
Multimodal transport improvements (walking, cycling, public transit, etc.). Transportation demand management. More accessible land development. Mobility substitutes such as telework. |
|
Performance indicators |
Vehicle traffic speeds, roadway Level-of-Service (LOS), distance-based crash and emission rates. |
Overall accessibility (number of service and activities that can be reached within a given time period). Multimodal LOS. Various economic, social and environmental impacts. |
The old planning paradigm evaluated urban transportation system performance based primarily on congestion delay, using indicators such as roadway Level of Service (LOS) and the Travel Time Index (TTI). It assumed that "transportation" means driving, so "transportation problem" means delays to driving, and “transportation improvement” means faster driving. These assumptions encourage transportation agencies to expand highways and underinvest in slower but more affordable, healthy, and resource-efficient modes.
The ultimate impacts of these biases can be huge because transportation planning decisions can have large indirect effects: each additional dollar spent to expand roads tends to leverage several additional dollars spent on automobile travel, causes many more dollars' worth of economic, social and environmental costs, impacts that could be reduced if those dollars were spent on more affordable and resource-efficient modes. In other words, planning decisions can create self-fulfilling prophecies: if agencies plan to accommodate more vehicle travel we’ll get more traffic, but if we plan for more compact, multimodal communities we can improve accessibility with much lower costs.
Think about the ugliest road in your community, perhaps a four to eight lane arterial with traffic speeds that exceed 50 miles per hour, and terrible walking and bicycling conditions; conventional roadway performance indicators would give this a high rating because it maximizes automobile traffic flow. In contrast, consider your favorite road, perhaps a tree-lined country road or a pedestrian-oriented commercial street; conventional roadway indicators would rate it poorly, since traffic speeds are low and traffic volumes are limited. Does that really reflect what travelers want? I don’t think so.
The Urban Mobility Report
A good example of an outdated planning document is the newest "Urban Mobility Report" (UMR), recently published by the Texas Transportation Institute.
I've criticized previous editions of the UMR in blogs ("Smart Congestion Costing: A Critical Evaluation of the 'Urban Mobility Report'" and "Congestion Costing Point-Counter-Point"), and detailed studies, "Congestion Costing Critique: Critical Evaluation of the 'Urban Mobility Report,'" "Smart Congestion Relief" and "Congestion Costing Best Practices."
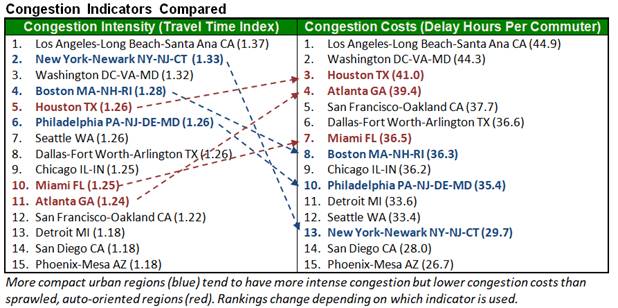
There is much to criticize. The UMR ignores basic research principles. It contains no literature review, fails to explain many assumptions or cite sources, does not discuss criticisms or potential biases, has no sensitivity analysis, and lacks independent peer review. It fails to give readers the information they need to understand its results. For example, it ranks compact, multi-modal cities such as Boston, New York and Washington DC as having worst congestion than more sprawled, automobile-dependent cities such as Atlanta, Houston and Miami, but fails to mention that this ranking reflects congestion costs measured per motorist, and if measured per commuter, multi-modal urban regions tend to rate much better due to their lower automobile mode shares and shorter travel distances.
Questions and Criticisms
Below are some key discussion questions and criticisms.
Is the title appropriate?
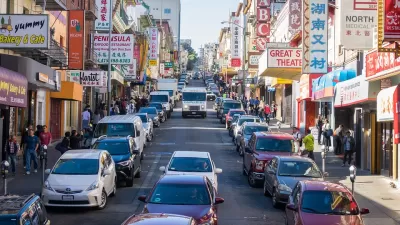
Urban transportation is multimodal: urban residents often walk, bike, rideshare and use public transit, and increasingly rely on telework and delivery services. In a typical city, 20-40% of peak-period trips are made by walking, bicycling or public transit. Yet, the UMR only evaluates automobile travel conditions – it contains no information about other forms of urban mobility. It also provides no information on other planning goals such as affordability, safety, or social equity. To be more accurate, the Urban Mobility Report should be renamed the Urban Congestion Report.
Who does it represent?
The UMR promotes motorists’ interests; people who rely on other modes are ignored. It treats motorists as victims, ignoring the fact that motorists are also congestion perpetrators. It only considers active and public transit improvements worthwhile to the degree that they reduce congestion.
What is the UMR’s message?
Its main message is that traffic congestion is a severe problem that deserves strong solutions.
Is the UMR optimistic or pessimistic?
My friend, Joe Cortright, recently critiqued the UMR in, "It’s Back, and It’s Even Dumber Than Ever: The Urban Mobility Report." As he points out, the newest UMR ignores recent evidence that telework and work-at-home can significantly reduce congestion problems; it sees a dark cloud rather than a silver lining. This is fearmongering.
How do its results compare with other congestion cost estimates?
Compared with other congestion cost studies the UMR:
- Uses higher baseline speeds and travel time cost values than most experts recommend.
- Significantly exaggerates fuel savings and emission reductions.
- Ignores the effects of induced vehicle travel.
- Ignores the harms that wider roads and increased vehicle traffic impose on communities.
These biases overestimate congestion costs, exaggerate roadway expansion benefits, and undervalue other congestion-reduction strategies. The newest UMR estimates that congestion costs averaged $605 per motorist in 2020, but that should be viewed as a higher bound estimate; more realistic baseline speeds, travel time costs, and fuel consumption models reduce this to $150-300 per motorist, making it a modest cost overall. Most motorists seem to agree, although they complain about congestion, few support decongestion pricing or major tax increases that would solve this problem.
What solutions does it promote? What does it ignore?
The UMR promotes a variety of congestion reduction strategies, including roadway expansions. It ignores the effects of generate vehicle traffic, the additional vehicle travel that occurs after a congested roadway is expanded. It also ignores the co-benefits, that is, the congestion reduction strategies that, by improving non-auto modes and reducing total vehicle travel, help achieve affordability, safety, equity, and environmental goals.
Better Solutions
Planners, policy makers-makers, and the general public need credible information on congestion costs and the effects of potential congestion reduction strategies. The UMR provides widely cited congestion cost estimates, but its analysis is neither comprehensive nor objective.
Its biases are significant because planning decisions often involve trade-offs between different solutions. For example, road space can either be used for general traffic lanes or bus lanes, and money spent to expand roads is unavailable for other purposes. By exaggerating congestion costs relative to other impacts and ignoring generated traffic impacts, the UMR tends to overvalue urban roadway expansions and undervalue other congestion reduction strategies that provide more co-benefits, such as the congestion reduction strategy that also increases affordability, improves public health and safety, or reduces pollution emissions.
Here are specific recommendations for more accurate congestion evaluation:
- Evaluate transport system performance based on overall accessibility (people’s overall ability to reach desired services and activities) rather than just mobility (travel speed).
- Measure congestion costs rather than intensity. Intensity indicators, such as roadway LOS and the TTI, do not account for exposure (the amount that residents must drive during peak periods) and therefore their total congestion cost burden.
- Measure delays to all travelers, not just to motorists. Account for pedestrian and cycling delays caused by wider roads and increased vehicle traffic, and the congestion avoided when travelers shift to public transit.
- Report the congestion costs travelers impose rather than just the costs they bear, when calculating efficient road prices or comparing the congestion costs of different modes.
- Use efficiency-optimizing rather than freeflow baseline speeds. Moderate traffic speeds (typically 40-50 miles per hour) maximize roadway throughput and fuel economy, so moderate congestion is usually most efficient overall.
- Use travel time values that reflect users’ actual willingness-to-pay for incremental speed gains. This is typically 20-40% of average wages for personal travel.
- Recognize variations in travel time values, and therefore, the efficiency gains provided by policies that favor higher value trips over lower-value trips. This justifies high-occupant vehicle priority strategies, and efficient road pricing.
- Recognize that congestion tends to maintain self-limiting equilibrium: it increases to the point that delays limit further peak-period vehicle travel.
- Account for generated and induced vehicle travel (additional vehicle travel resulting from reduced congestion) when evaluating roadway expansions. Generated traffic tends to reduce long-term congestion reduction benefits, and induced travel tends to increase external costs including downstream congestion, accident risk and pollution emissions.
- Account for co-benefits when evaluating potential congestion reduction strategies. Strategies that improve non-auto modes or efficiently price travel also tend to reduce parking costs, provide consumer savings, improve accessibility for non-drivers, increase safety and health, reduce pollution emissions, and support strategic land use objectives.
- Account for data biases. For example, the Inrix data used in the UMR over samples congested roadways and so exaggerate average motorists’ congestion costs.
Automobiles are wonderful servants but terrible masters. We should design our communities for maximum livability, with optimal vehicle traffic volumes and speeds. We should never design communities for cars and treat people as a second thought. This means that it’s time to jettison the Urban Mobility Report and replace it with Accessibility Indicators.
For more information see:
Marlon G. Boarnet, et al. (2017), The Economic Benefits of Vehicle Miles Traveled (VMT)- Reducing Placemaking: Synthesizing a New View, White Paper from the National Center for Sustainable Transportation.
Joe Cortright (2019), The Top Twenty Reasons to Ignore TTI’s Latest Urban Mobility Report, City Observatory.
ITF (2021), Decongesting our Cities Summary and Conclusions, International Transport Forum.
Amy E. Lee and Susan L. Handy (2018), “Leaving Level-of-service Behind: The Implications of a Shift to VMT Impact Metrics,” Research in Transportation Business & Management, Vol. 29, pp. 14-25.
David M. Levinson, Wes Marshall and Kay Axhausen (2018), Elements of Access: Transport Planning for Engineers, Transport Engineering for Planners, Transportist.
Todd Litman (2019), Congestion Costing Critique: Critical Evaluation of the ‘Urban Mobility Report,’ Victoria Transport Policy Institute.
Todd Litman (2021), Smart Congestion Relief, Victoria Transport Policy Institute.
SSTI (2018), Modernizing Mitigation: A Demand-Centered Approach, State Smart Transportation Initiative and the Mayors Innovation Project.

Planning for Congestion Relief
The third and final installment of Planetizen's examination of the role of the planning profession in both perpetuating and solving traffic congestion.
How Planning Fails to Solve Congestion
Solutions for congestion are never as simple and easy as armchair planners and engineers would like you to believe—especially those who suggest that congestion can be solved by forever building more roadway capacity.
Planning and the Complicated Causes and Effects of Congestion
What do planners know about congestion, and what can they do about it? Explanations and solutions are less obvious than they seem (part one of a three-part series).

Trump Administration Could Effectively End Housing Voucher Program
Federal officials are eyeing major cuts to the Section 8 program that helps millions of low-income households pay rent.

Planetizen Federal Action Tracker
A weekly monitor of how Trump’s orders and actions are impacting planners and planning in America.

The 120 Year Old Tiny Home Villages That Sheltered San Francisco’s Earthquake Refugees
More than a century ago, San Francisco mobilized to house thousands of residents displaced by the 1906 earthquake. Could their strategy offer a model for the present?

HSR Reaches Key Settlement in Northern California City
The state’s high-speed rail authority reached an agreement with Millbrae, a key city on the train’s proposed route to San Francisco.

Washington State Legislature Passes Parking Reform Bill
A bill that would limit parking requirements for new developments is headed to the governor’s desk.

Missouri Law Would Ban Protections for Housing Voucher Users
A state law seeks to overturn source-of-income discrimination bans passed by several Missouri cities.
Urban Design for Planners 1: Software Tools
This six-course series explores essential urban design concepts using open source software and equips planners with the tools they need to participate fully in the urban design process.
Planning for Universal Design
Learn the tools for implementing Universal Design in planning regulations.
Ada County Highway District
Clanton & Associates, Inc.
Jessamine County Fiscal Court
Institute for Housing and Urban Development Studies (IHS)
City of Grandview
Harvard GSD Executive Education
Toledo-Lucas County Plan Commissions
Salt Lake City
NYU Wagner Graduate School of Public Service