


Reports of New York's gentrification are sometimes exaggerated.

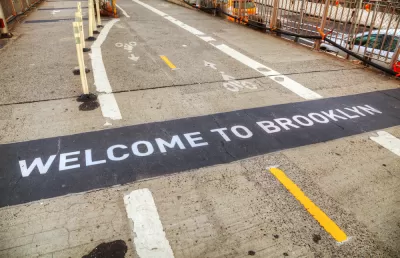
The New York City’s Comptroller’s Office recently put out a report with a treasure trove of data about New York City neighborhoods. Some press coverage of the report focused on gentrification. For example, CityLab headlines one article, "The Gentrification of Gotham," and suggests that the decline of black population in some neighborhoods "suggests not everyone shares in a neighborhood’s economic success." Obviously, such rhetoric conveys a simple message: gentrification is everywhere and gentrification is bad.
But three of New York's five boroughs actually de-gentrified. If (like the CityLab article) you prefer to measure gentrification by race, the Bronx lost 30 percent of its white population between 2000 and 2015, while gaining blacks and Hispanics. Similarly, in Staten Island the number of whites decreased while the number of blacks and Hispanics decreased, and Queens gained Hispanics while losing both whites and blacks.
If you prefer to measure gentrification by income, the results are similar. In the Bronx, the number of people earning less than $25,000 increased by 30 percent, while the number earning over $75,000 decreased. In Staten Island, the former number increased by 25 percent while the latter number again decreased. In Queens, the number earning over $75,000 increased by 12 percent—but the number of persons earning less than $25,000 increased by a greater amount (19 percent). In sum, three of the five boroughs have become browner and poorer since 2000.
So at most, the CityLab article should have been titled "The Gentrification of Manhattan and Brooklyn." And in those boroughs, there are a few neighborhoods that fit the popular stereotype of gentrification: increased white population, decreased black and Hispanic population, increased rich population, reduced poor population. For example, in Greenpoint/Williamburg, the number of whites increased by 41 percent and the numbers of both blacks and Hispanics decreased. The number of people earning over $75,000 (adjusted for inflation) increased by 363 percent, while the number of people earning under $25,000 (again, adjusted for inflation) decreased. In Brooklyn Heights/Fort Greene, the Lower East Side, Bushwick, and Park Slope, the white population increased while the black/Hispanic population decreased.
But how common was this scenario? Not very. In fact, several Brooklyn neighborhoods (mostly those furthest from Manhattan) experienced the classic "white flight" scenario: fewer whites, more blacks and Hispanics. In East New York/Starrett City, the number of whites decreased by 43 percent between 2000 and 2015, while the black and Hispanic populations increased. Similarly, in Canarsie the white population decreased by 29 percent while the Hispanic and black populations increased by 24 and 40 percent respectively. In Bay Ridge/Dyker Heights, the white population nosedived by 20 percent, while the Hispanic population increased by 53 percent and the black population by 12 percent. In Bensonhurst/Bath Beach, the white population declined by 31 percent while the black and Hispanic populations more than doubled. In Boro Park/Kensington, the white population decreased slightly and the black population increased slightly. In all of these neighborhoods, the low income population increased (and in Boro Park, the high-income population actually decreased).
Moreover, even some affluent parts of Manhattan became more somewhat more diverse. My own Murray Hill/Gramercy and the Upper West Side are still affluent white neighborhoods, but the white population decreased, while the black and/or Hispanic populations increased. And in both places, the number of people earning under $25,000 increased.
And some neighborhoods don’t fit either the "gentrification" narrative or the "white flight" narrative. One common pattern was the "Hispanic growth" pattern, exemplified by Sheepshead Bay. There, the number of both whites and blacks went down, while the Hispanic population increased 111 percent. In Brighton Beach, East Flatbush, Crown Heights, Bedford-Stuyvestant, and Midwood, the white population went up and the black population went down—but the Hispanic population increased. In all but one of these areas (East Flatbush) the number of persons earning under $25,000 increased (although the number of higher income persons increased as well). In Manhattan, Central Harlem experienced both huge white growth and huge Hispanic growth (an increase of over 80 percent).
A few neighborhoods don’t fit any of these narratives. In Brownsville, the populations of all racial groups increased. But the number of low-income persons increased more rapidly than the number of persons earning over $75.000. Similarly, in Sunset Park, East Harlem and Washington Heights, the white population increased while the Hispanic and black populations decreased—but the number of low-income earners increased as well.
Finally, all of the above should be put in perspective: even Manhattan and Brooklyn are far more diverse than most suburbs. Manhattan is 48 percent non-Hispanic white and Brooklyn is 1/3 white, while suburban Suffolk County is 71 percent white.

Census Data: Black Americans Leaving Cities for Suburbs
The trend of Black Americans leaving urban areas for suburban communities mirrors the White Flight of the mid-20th century but for vastly different reasons and with vastly different consequences.
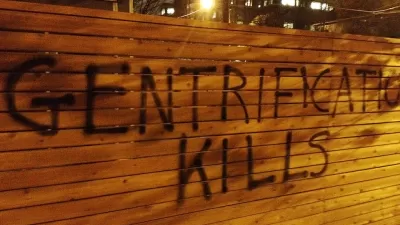
What We Really Mean When We Say Gentrification
The focus on gentrifying communities has, in many cases, eclipsed the similar problems facing more stagnant neighborhoods.
Columnist: New York City Needs Economic Recovery Strategies Other Than Gentrification
It's a tale of two cities as New York starts to emerge from the pandemic.

Alabama: Trump Terminates Settlements for Black Communities Harmed By Raw Sewage
Trump deemed the landmark civil rights agreement “illegal DEI and environmental justice policy.”

Planetizen Federal Action Tracker
A weekly monitor of how Trump’s orders and actions are impacting planners and planning in America.

Why Should We Subsidize Public Transportation?
Many public transit agencies face financial stress due to rising costs, declining fare revenue, and declining subsidies. Transit advocates must provide a strong business case for increasing public transit funding.

Understanding Road Diets
An explainer from Momentum highlights the advantages of reducing vehicle lanes in favor of more bike, transit, and pedestrian infrastructure.

New California Law Regulates Warehouse Pollution
A new law tightens building and emissions regulations for large distribution warehouses to mitigate air pollution and traffic in surrounding communities.

Phoenix Announces Opening Date for Light Rail Extension
The South Central extension will connect South Phoenix to downtown and other major hubs starting on June 7.
Urban Design for Planners 1: Software Tools
This six-course series explores essential urban design concepts using open source software and equips planners with the tools they need to participate fully in the urban design process.
Planning for Universal Design
Learn the tools for implementing Universal Design in planning regulations.
Caltrans
Smith Gee Studio
Institute for Housing and Urban Development Studies (IHS)
City of Grandview
Harvard GSD Executive Education
Toledo-Lucas County Plan Commissions
Salt Lake City
NYU Wagner Graduate School of Public Service