


The U.S. Department of Transportation wants to hear from the public to help explain the 35,092 traffic deaths last year, an increase of 2,348 people from 2014. It has issued a 'call to action' to help interpret the data.
The National Highway Traffic Safety Administration (NHTSA) issued final 2015 traffic fatality data on Aug. 31, revising its preliminary 2015 estimate of 35,200. Note that they use different data from the National Safety Council which released preliminary 2015 data in February.
"We’re directly soliciting your help to better understand what these data are telling us," write DJ Patil, Deputy Chief Technology Officer for Data Policy and Chief Data Scientist in the White House Office of Science and Technology Policy, and Dr. Mark Rosekind, Administrator of the National Highway Traffic Safety Administration (NHTSA), in the U.S. DOT blog, Fast Lane. (Cross-posted at the White House Office of Science and Technology Policy blog).
Whether you’re a non-profit, a tech company, or just a curious citizen wanting to contribute to the conversation in your local community, we want you to jump in and help us understand what the data are telling us.
We are calling on data scientists, public health experts, students and researchers—even if you have never thought about road safety before—to dive in to these data and help answer these important questions, especially on tough issues like pedestrian and bicyclist fatalities.
The data comes in the forms of:
- August 2016 "Traffic Safety Facts" Research Note: 2015 Motor Vehicle Crashes: Overview (9-pages)
- NHTSA’s Fatality Analysis Reporting System (FARS), published three months early (very detailed)
"The last single-year increase of this magnitude was in 1966, when fatalities rose 8.1% from the previous year," notes the NHTSA release. The chart below only dates back to 1975.

Courtesy of Fast Lane
From NHTSA Aug. 29 press release:
According to NHTSA, job growth and low fuel prices were two factors that led to increased driving, including increased leisure driving and driving by young people. More driving can contribute to higher fatality rates. In 2015, vehicle miles traveled (VMT) increased 3.5% [PDF] over 2014, the largest increase in nearly 25 years. [See Planetizen news post and blog on the end of peak car].
However, correlation with increased driving does not imply causation. Why would fatalities increase at twice the rate of VMT?
While the research note provides a chart for the change in crash causes [see page 6: Figure 9: Percentage Change by Human Choice Category, 2014–2015], with distracted driving showing the largest increase at 8.8%, the only actual numbers and percentage for the 35,092 total fatalities is for alcohol-related crashes:
- Alcohol-impaired driving fatalities increased by 3.2 percent, from 9,943 in 2014 to 10,265 in 2015. [29%].
Here's what National Safety Council recently listed as the three main causes:
According to Injury Facts 2016, the Council’s annual report on unintentional injuries, the three biggest causes of fatalities on the road include:
- Alcohol (30.8%)
- Speeding (30%)
- Distracted driving (26%)
Finally, to see a break-out of categories of "Fatality and Injury Changes by Person Type", scroll down to page 4, Table 3, "Occupants and Nonoccupants Killed and Injured in Traffic Crashes."
As with past years, the two greatest increases were for cyclists (12.2%) and pedestrians (9.5%). See recent posts on bike and pedestrian fatalities.
DOT wants to hear from you!
OK, readers, here's your opportunity to share your insights with the U.S. DOT. After reviewing August 2016 "Traffic Safety Facts" Research Note: 2015 Motor Vehicle Crashes: Overview, send a note to [email protected]. Note the four bulleted questions Patil and Rosekind suggest.
Related national traffic fatality data posts this year:
- National Safety Council: (Estimated) Traffic Deaths Take a Big Jump in 2016, August 29, 2016
- NHTSA: (Preliminary) 2015 Road Toll: 35,200 Fatalities, July 6, 2016
- National Safety Council Reports Huge Jump in 2015 Traffic Fatalities, February 22, 2016
-
Federal (NHTSA) Report Finds Increasing Numbers of Traffic Deaths, February 19, 2016.
-
Comparison to other developed nations, September 6, 2016
Hat tip to Mark Boshnack.
FULL STORY: 2015 Traffic Fatalities Data Has Just Been Released: A Call to Action to Download and Analyze


2015 Road Toll: 35,200 Fatalities
The National Highway Traffic Safety Administration (NHTSA) released preliminary fatality estimates for 2015. Deaths jumped by 2,525, an increase of 7.7 percent over 2014. Pedestrians and bicyclists saw the biggest increases.

Latest Traffic Safety Data Adds Grim Death Count to an Already Tragic Year
The public health epidemic created by dangerous roads, dangerous cars, and dangerous drivers was exacerbated by the COVID-19 pandemic, according to recent data from the National Highway Traffic Safety Administration.
Traffic Fatalities Decline for a Third-Straight Year 2019, According to New Data
The National Highway Traffic Safety Administration's Fatality Analysis Reporting System released its preliminary estimates this week.

Study: Maui’s Plan to Convert Vacation Rentals to Long-Term Housing Could Cause Nearly $1 Billion Economic Loss
The plan would reduce visitor accommodation by 25,% resulting in 1,900 jobs lost.

North Texas Transit Leaders Tout Benefits of TOD for Growing Region
At a summit focused on transit-oriented development, policymakers discussed how North Texas’ expanded light rail system can serve as a tool for economic growth.

Why Should We Subsidize Public Transportation?
Many public transit agencies face financial stress due to rising costs, declining fare revenue, and declining subsidies. Transit advocates must provide a strong business case for increasing public transit funding.
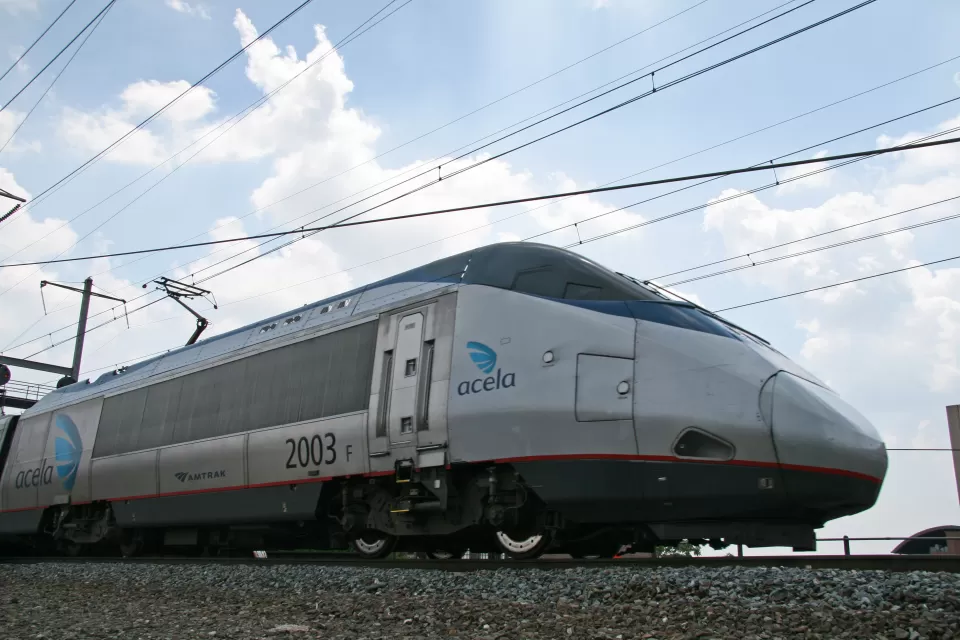
How to Make US Trains Faster
Changes to boarding platforms and a switch to electric trains could improve U.S. passenger rail service without the added cost of high-speed rail.

Columbia’s Revitalized ‘Loop’ Is a Hub for Local Entrepreneurs
A focus on small businesses is helping a commercial corridor in Columbia, Missouri thrive.

Invasive Insect Threatens Minnesota’s Ash Forests
The Emerald Ash Borer is a rapidly spreading invasive pest threatening Minnesota’s ash trees, and homeowners are encouraged to plant diverse replacement species, avoid moving ash firewood, and monitor for signs of infestation.
Urban Design for Planners 1: Software Tools
This six-course series explores essential urban design concepts using open source software and equips planners with the tools they need to participate fully in the urban design process.
Planning for Universal Design
Learn the tools for implementing Universal Design in planning regulations.
Ascent Environmental
Borough of Carlisle
Institute for Housing and Urban Development Studies (IHS)
City of Grandview
Harvard GSD Executive Education
Toledo-Lucas County Plan Commissions
Salt Lake City
NYU Wagner Graduate School of Public Service