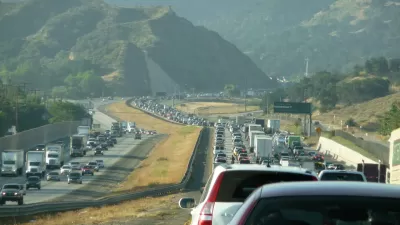
New driving totals are out for June and and the first six months of 2016, and the news is not good for those who want to see a reduction in what is now the greatest source of the nation's greenhouse gas emissions.

A June Planetizen news headline indicated that for the first time since 1979, carbon emissions from transportation supplanted those from the power sector as the main source of climate-change in the United States.
Monday's press release from the U.S. Department of Transportation notes that vehicle miles traveled (VMT) increased 3.3 percent in the first six months of the year continues the trend, and should mean that efforts to improve fuel economy by DOT and reduce emissions by the U.S. Environmental Protection Agency will fall short if Americans continue to drive more as they have been doing since March 2014.
By comparison, U.S. population has been increasing .77 percent per year.
"New data released today by the U.S. Department of Transportation’s Federal Highway Administration (FHWA) show that U.S. driving reached 1.58 trillion miles in the first six months of 2016, beating the previous record of 1.54 trillion miles set last year," reports Doug Hecox, spokesman for the Federal Highway Administration. "The estimates include passenger vehicle, bus and truck travel."
The new data, published in FHWA’s latest “Traffic Volume Trends” report – a monthly estimate of U.S. road travel – show that more than 282.3 billion miles were driven in June 2016 alone which is a slight increase over the previous June.
Hecox breaks out mileage data by regions, with the West reporting the greatest increase at 4.1 percent, and the Northeast, at 2.4 percent, the smallest, similar to a June 2015 post based on DOT's Traffic Volume Trends.
At 8.6 percent, Hawaii led the nation with the largest unadjusted single-state traffic percent increase compared to the same month a year earlier, followed by Idaho and Utah at 5.1 percent each. At 2.4 percent, North Dakota had the nation’s only unadjusted traffic decrease for the month.
The 2007 VMT record was shattered last year, reported Planetizen blogger Steve Polzin in March. "Perhaps even more disconcerting was the sharp increase in per capita VMT, up approximately 2.6 percent for 2015," wrote Polzin, though noting that it hadn't yet surpassed "the prior peak per capita travel levels of the past decade of over 10,000 miles per year per person." [See graph].
For more information, see the 24-page June Traffic Volume Trends June 2016 report [PDF].
Hat tip to AASHTO Daily Transportation Update.
FULL STORY: U.S. Driving Up 3.3 Percent In First Half of 2016, New Federal Data Show

Alabama: Trump Terminates Settlements for Black Communities Harmed By Raw Sewage
Trump deemed the landmark civil rights agreement “illegal DEI and environmental justice policy.”

Study: Maui’s Plan to Convert Vacation Rentals to Long-Term Housing Could Cause Nearly $1 Billion Economic Loss
The plan would reduce visitor accommodation by 25% resulting in 1,900 jobs lost.

Why Should We Subsidize Public Transportation?
Many public transit agencies face financial stress due to rising costs, declining fare revenue, and declining subsidies. Transit advocates must provide a strong business case for increasing public transit funding.

Paris Bike Boom Leads to Steep Drop in Air Pollution
The French city’s air quality has improved dramatically in the past 20 years, coinciding with a growth in cycling.

Why Housing Costs More to Build in California Than in Texas
Hard costs like labor and materials combined with ‘soft’ costs such as permitting make building in the San Francisco Bay Area almost three times as costly as in Texas cities.

San Diego County Sees a Rise in Urban Coyotes
San Diego County experiences a rise in urban coyotes, as sightings become prevalent throughout its urban neighbourhoods and surrounding areas.
Urban Design for Planners 1: Software Tools
This six-course series explores essential urban design concepts using open source software and equips planners with the tools they need to participate fully in the urban design process.
Planning for Universal Design
Learn the tools for implementing Universal Design in planning regulations.
Smith Gee Studio
Alamo Area Metropolitan Planning Organization
City of Santa Clarita
Institute for Housing and Urban Development Studies (IHS)
City of Grandview
Harvard GSD Executive Education
Toledo-Lucas County Plan Commissions
Salt Lake City
NYU Wagner Graduate School of Public Service


