


The transportation policy debate regularly falls victim to incorrect or incomplete "facts" getting passed around like the game of telephone.

I recently came across the provocatively titled article "Secretive Alphabet division funded by Google aims to fix public transit in US" published in The Guardian, June 27, 2016. Of course I anxiously read the article with the hopes that Google had found the missing ingredient to make public transit more effective and efficient. Yes, more technology and more data can help—just how much remains to be seen. Travel behavior decisions are influenced by a host of factors, time and money cost, convenience, flexibility, perceived safety and security, image, reliability, awareness of opportunities, etc. Even absent a teleportation app, technology can improve the travel experience for all modes and may well ultimately alter mode preferences and travel behaviors.
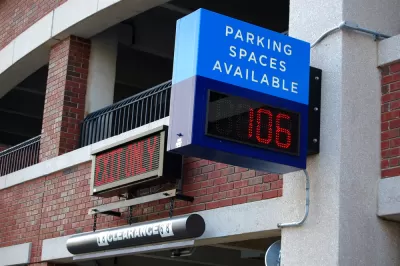
As I continued reading, my confidence in a transformational change diminished with each sentence. But I did stumble across one of my pet peeves—the infamous allusion to 30 percent of traffic in cities being due to drivers seeking parking. The Guardian story contained the following quote.
"The emails and documents show that Flow applies Google’s expertise in mapping, machine learning and big data to thorny urban problems such as public parking. Numerous studies have found that 30 percent of traffic in cities is due to drivers seeking parking."
As someone who pays attention to travel behavior data, I instantaneously choked on the implication that 30 percent of traffic in cities is caused by drivers looking for parking. No how, no way, not even on Monday’s afternoon rush-hour, not even in our biggest cities. I had to dig a little deeper. The story’s "numerous studies" linked to the often-cited Donald Shoup article "Cruising for Parking Transport Policy". The reference to numerous studies evidently referred to the case studies Dr. Shoup was able to assemble in his research—some of which appears to be single data points. This 30 percent average, rather incidental and appropriately qualified data in the original paper, has taken on a life of its own and is regularly cited as evidence for everything from the opportunities for better parking management to the benefits of public transit to the wastefulness of auto dependency to the current prospect of mitigating congestion by virtue of eliminating parking through automated vehicles. Indeed, Google Scholar shows over 300 citations, with nearly 100 reported in Web of Science.
The references to this 30 percent number remind me of the game "telephone" we used to play as youngsters. A group of people line up and someone whispers a passage into the ear of the first person. The message is successively whispered to the end of the line where it is repeated aloud. It often only vaguely resembles the original message. The mismatch between the original phrase and the resultant phrase is always good for a laugh.
Table 1 below is extracted from the Shoup article. Let’s look at the data a little closer. There are only six data points. The first two are from Detroit in 1927. At that time Detroit was the fastest-growing large city in the country. Its population was over twice its current level. Who would use 90-year-old data on cruising for parking at two points in Detroit to extrapolate to current conditions? The 1977 City of Freberg data accounts for 40 percent of the average of 30 percent cruising traffic. Freberg is a German university city of approximately 40,000 people now. There is no geographic context and no weighting or scaling of the data to develop a meaningful quantification of its significance in the context of total travel, urban travel, central business district travel, etc. but for some reason that hasn't stopped people from using the data to support various perspectives. The reality is that we do not have much of a handle as to the amount of time or mileage that vehicles spend searching for parking in America in 2016.
|
Table 1, Twentieth Century Cruising |
|||
|
YEAR |
CITY |
SHARE OF TRAFFIC CRUISING |
SEARCH TIME |
|
1927 |
Detroit (1) |
19% |
— |
|
1927 |
Detroit (2) |
34% |
— |
|
1933 |
Washington |
— |
8.0 |
|
1960 |
New Haven |
17% |
— |
|
1965 |
London (1) |
— |
6.1 |
|
1965 |
London (2) |
— |
3.5 |
|
1965 |
London (3) |
— |
3.6 |
|
1977 |
Freiburg |
74% |
6.0 |
|
1984 |
Jerusalem |
— |
9.0 |
|
1985 |
Cambridge |
30% |
11.5 |
|
1993 |
Cape Town |
— |
12.2 |
|
1993 |
New York (1) |
8% |
7.9 |
|
1993 |
New York (2) |
— |
10.2 |
|
1993 |
New York (3) |
— |
13.9 |
|
1997 |
San Francisco |
— |
6.5 |
|
2001 |
Sydney |
— |
6.5 |
|
AVERAGE |
30% |
8.1 |
|
|
Note: The numbers after Detroit, London, and New York refer to different locations within the same city. |
|||
|
Reproduced from "Cruising for Parking," Access, Number 30, Spring 2007, p 17. |
In an era where a huge share of research and media reporting has a strong advocacy orientation or motivational biases, it is critical to delve into the data being cited a little deeper. Subtle context conditions or interpretations can result in dramatically different meanings. We have enough readily available and citable and seemingly credentialed sources to find supporting evidence for virtually any perspective. Folks need to be careful about playing telephone with planning data.
In a related area, policy and media folks are latching on to select facts to create impressions regarding the future impacts of technology. A couple of examples were included in a recent Wall Street Journal piece, "Driverless Cars to Fuel Suburban Sprawl: Research suggests advances in transportation technology contribute to bigger and more sprawling cities," Christopher Mims, June 20, 2016.
"Here is the weirdest thing about this hypothetical future: where you live. Nearly everyone who has studied the subject believes these self-driving fleets will be significantly cheaper than owning a car, which sits idle roughly 95 percent of the time."
Looking at the 95 percent number, one can in fact look at household owned vehicle data from the 2009 National Household Travel Survey and verify that an average vehicle operates a little more than one hour per 24-hour day. As this 95 percent number is used in various reports and presentations, it creates the impression that this asset is being underutilized and with the power of logistics and shared ownership we can squeeze significant efficiencies by utilizing this capital asset more intensively. However, mileage and time-in-use tend to be meaningfully higher in newer vehicles. Older and specialized vehicles are used less, hence, that camper in the backyard or convertible in the garage are more likely to be available but aren’t really particularly easily redeployed transportation assets. The reality that over 80 percent of travel occurs in the peak 12 hours further dampens the actual redeploy-ability of that capital asset. And, unlike perishable assets like room nights, automobiles depreciate based on both time and mileage. A parked vehicle is not depreciating as fast as an in-use vehicle. A true assessment of the economic benefit of redeploying/sharing vehicles would need to consider a more robust economic assessment of vehicle depreciation. Finally, the 95 percent characterization implies that a vehicle needs to be driven to be "in use" while to consumers, immediate assured vehicle availability has value. When a household member gets sick, a wildfire hits residential areas in the West or a hurricane moves toward shore in the Atlantic, having assurance of a readily available vehicle has a value that is perhaps underrepresented by the characterization of the average auto being idle 95 percent of the time.
That same story had another paragraph:
"Shared self-driving cars will have taken so many vehicles off the road—up to 80% of them, according to one Massachusetts Institute of Technology study—that you’re either getting to work in record time or traveling farther in the same time, to a new class of exurbs."
Up to 80 percent? You can vet this one on your own.
The opinions are those of the author – or maybe not – but are intended to provoke reflection and do not reflect the policy positions of any associated entities or clients. [email protected].


Why Google's 'Sidewalk Labs' Is Such a Big Deal
Earlier in June, Google announced the creation of an "urban innovation company" called Sidewalk Labs. One writer explains the genesis of the company as well as its potential for the future of how cities operate.
Google Launches its First Smart Cities Company: Sidewalk Labs
Google, already one of the most pervasive technology providers of urban experiences everywhere, has increased its bet on the smart cities movement.
Has Anyone at USDOT Read Donald Shoup?
USDOT employees, who are required to go back to the office, will receive free parking at the agency’s D.C. offices — flying in the face of a growing research body that calls for pricing parking at its real value.

Alabama: Trump Terminates Settlements for Black Communities Harmed By Raw Sewage
Trump deemed the landmark civil rights agreement “illegal DEI and environmental justice policy.”

Planetizen Federal Action Tracker
A weekly monitor of how Trump’s orders and actions are impacting planners and planning in America.

The 120 Year Old Tiny Home Villages That Sheltered San Francisco’s Earthquake Refugees
More than a century ago, San Francisco mobilized to house thousands of residents displaced by the 1906 earthquake. Could their strategy offer a model for the present?

In Both Crashes and Crime, Public Transportation is Far Safer than Driving
Contrary to popular assumptions, public transportation has far lower crash and crime rates than automobile travel. For safer communities, improve and encourage transit travel.

Report: Zoning Reforms Should Complement Nashville’s Ambitious Transit Plan
Without reform, restrictive zoning codes will limit the impact of the city’s planned transit expansion and could exclude some of the residents who depend on transit the most.

Judge Orders Release of Frozen IRA, IIJA Funding
The decision is a victory for environmental groups who charged that freezing funds for critical infrastructure and disaster response programs caused “real and irreparable harm” to communities.
Urban Design for Planners 1: Software Tools
This six-course series explores essential urban design concepts using open source software and equips planners with the tools they need to participate fully in the urban design process.
Planning for Universal Design
Learn the tools for implementing Universal Design in planning regulations.
Clanton & Associates, Inc.
Jessamine County Fiscal Court
Institute for Housing and Urban Development Studies (IHS)
City of Grandview
Harvard GSD Executive Education
Toledo-Lucas County Plan Commissions
Salt Lake City
NYU Wagner Graduate School of Public Service