


Randal O'Toole claims that light rail transit is more dangerous than bus or automobile travel, but he fails to account for exposure or overall safety benefits. This is a good example of bad statistical analysis.

Randal O'Toole, who labels himself the "anti-planner" recently posted a blog, Light Rail Increasingly Dangerous, in which he estimates that light rail transit (LRT) causes 12.5 traffic fatalities per billion passenger-miles, compared with 4.9 for automobiles and just 4.5 for buses. He concludes that light rail is 2.5 times more dangerous than automobile travel. This is a good example of bad analysis.
O'Toole makes two major errors: he fails to account for exposure (the amount and type of risks that travelers experience), and ignores the various ways that high quality public transit tends to increase safety overall. People unfamiliar with the nuances of traffic risk analysis may find his evidence persuasive, but experts will recognize its errors. This explains why critics like O'Toole so seldom publish in peer-reviewed journals; their analysis cannot withstand professional scrutiny.
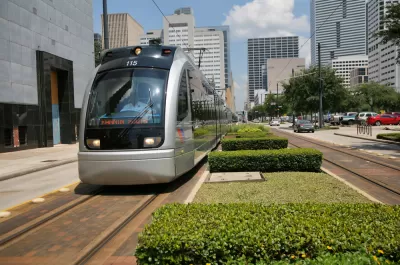
Most light rail accident victims are pedestrians. Light rail transit only operates in dense city centers where there are frequent interactions between various road users. Would buses and automobiles have lower crash rates under these conditions? They might. Trains cannot steer around an obstacle and are quieter than buses or cars, which might increase risks, but LRT also has features, such as professional drivers and wheel covers, that reduce risks. O'Toole's statistics do not really prove that light rail is more dangerous than other modes operating under the same conditions, we need an apples-to-apples comparison to answer that question.
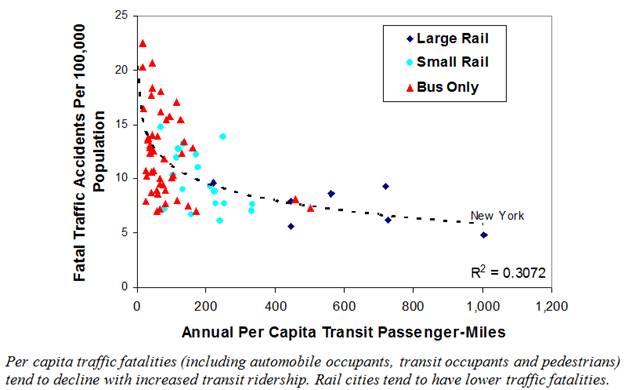
My research indicates that public transit investments can provide large community-wide safety benefits. Public transit travel has about a tenth the per passenger-mile traffic fatality rate as automobile travel, and total (pedestrian, cyclist, transit passenger, and automobile occupant) per capita traffic fatality rates tend to decline as transit ridership increases in a community. Many of these benefits are only perceivable if traffic risk is measured per capita rather than using distance-based indicators, such as fatalities per billion passenger-miles, since the benefits result, in part, from reductions in per capita vehicle travel. As a result, comparing crash risk per billion passenger-miles cannot reflect the full safety benefits of high quality public transit or transit-oriented development.
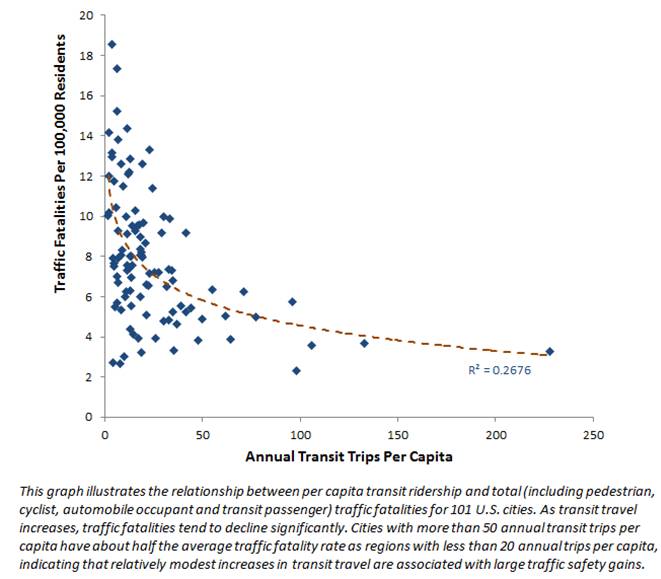
My recent journal article, A New Transit Safety Narrative, summarizes new research regarding public transit safety and security impacts. It found that cities with more than 50 annual transit trips per capita have about half the average traffic fatality rate as regions with less than 20 annual trips per capita, and residents of transit oriented developments have about a fifth the traffic fatality rates (that is, traffic fatalities decline 80 percent) as in automobile-dependent neighborhoods, indicating that relatively modest increases in transit travel are associated with large traffic safety gains, as illustrated below.
Traffic Fatalities Versus Transit Trips
Several factors probably contribute to these crash reductions. Transit-oriented community residents tend to drive less, local traffic speeds are lower, and higher-risk groups, such as driving by youths, seniors and drinkers, have good travel options which allows them to reduce their driving. As a result, traffic safety policies intended to reduce high-risk driving, such as graduated licenses and anti-drunk-driving campaigns, are likely to be more effective if implemented with public transit service improvements and more transit-oriented development.
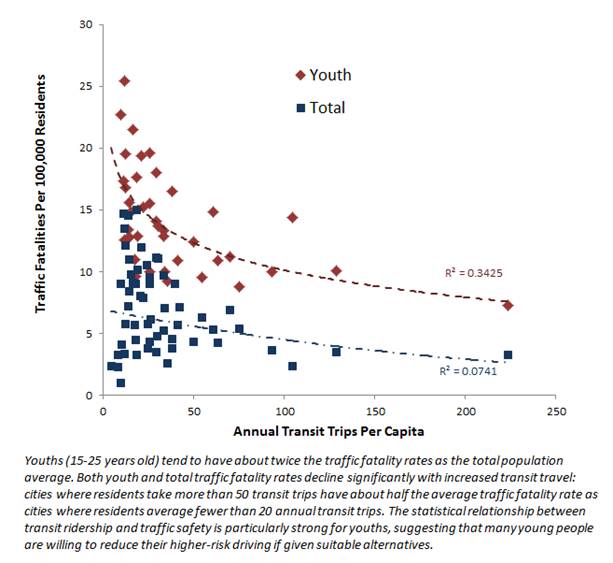
As evidence, consider the following graph, which shows that the reduction in traffic deaths in more transit-oriented cities is particularly strong for youths, which suggests that many young people want to reduce their vehicle travel and associated traffic risk but can only do so if they have good alternatives. High quality transit and transit-oriented development help make this happen.
Youth and Total Traffic Fatality Rates
O'Toole's analysis ignores these impacts and so undervalues public transit safety benefits. Most cities with high transit ridership have rail transit serving their downtown core. It is possible that high quality bus services, such as bus rapid transit, could provide the same benefits, but there are also good arguments for light rail transit on dense urban travel corridors: rail is quieter and more comfortable, can carry more passengers, attract more discretionary passengers (people who would otherwise drive), and tends to be more effective at stimulating transit-oriented development. Although LRT is not appropriate everywhere, it plays an important role in creating transit-oriented cities, thereby achieving substantial safety and cost savings benefits.
This is just one example of the importance of using an accurate framework for intermodal comparisons. I’ve seen other examples of bad analysis. For example, when comparing travel speeds, fuel consumption or operating costs between different modes it is important to use values that represent actual travel conditions rather than averages. Most light rail transit (LRT) travel occurs in congested urban conditions where vehicle speeds are relatively low and operating costs relatively high, so LRT costs should be compared with automobiles operating under urban-peak conditions. Similarly, rail transit line costs are sometimes compared with the average costs of building a roadway lane, without taking into account the relatively costs of building infrastructure in central cities. Accurate analysis accounts for these differences.
For More Information
Joshua Broyles (2014), Drinking and Driving and Public Transportation: A Test of the Routine Activity Framework, Master’s Degree Thesis, Arizona State University.
Todd Litman (2015), "Impacts of Rail Transit on the Performance of a Transportation System," Transportation Research Record 1930, Transportation Research Board, pp. 23-29; full report at www.vtpi.org/railben.pdf.
Todd Litman (2009), “Transportation Policy and Injury Control,”Injury Prevention, Vol. 15, Issue 6.
Todd Litman (2014), “A New Transit Safety Narrative,” Journal of Public Transportation, Vol. 17, No. 4, pp. 114-135; at; also see at www.vtpi.org/safer.pdf
Todd Litman and Steven Fitzroy (2005), Safe Travels: Evaluating Mobility Management Traffic Safety Impacts, Victoria Transport Policy Institute.
Ian Savage (2013). “Comparing The Fatality Risks In The United States Transportation Across Modes And Over Time,”Research in Transportation Economics, Vol. 43, No. 1, pp. 9-22.
Uber and MADD (2015), More Options. Shifting Mindsets. Driving Better Choices., Uber and Mothers Against Drunk Driving.


Let’s End Traffic Stops
The technology to make traffic enforcement obsolete is becoming available. But in the U.S. willing to use it?
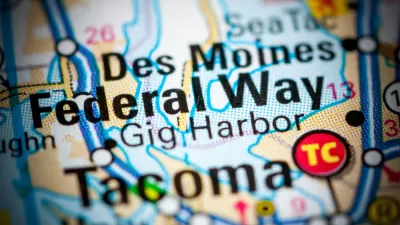
A Transit and Land Use Planning Shift in Federal Way, Washington
Federal funding for Sound Transit's Federal Way Link extension and a new transit-oriented land use plan are changing the future of Federal Way.
Speeding Up Trains and Improving Traffic Safety in San Jose
At-grade light rail has a hard time safely and efficiently traversing Downtown San Jose on Second Street. A new pilot project will look to improve the situation.

Alabama: Trump Terminates Settlements for Black Communities Harmed By Raw Sewage
Trump deemed the landmark civil rights agreement “illegal DEI and environmental justice policy.”

Planetizen Federal Action Tracker
A weekly monitor of how Trump’s orders and actions are impacting planners and planning in America.

The 120 Year Old Tiny Home Villages That Sheltered San Francisco’s Earthquake Refugees
More than a century ago, San Francisco mobilized to house thousands of residents displaced by the 1906 earthquake. Could their strategy offer a model for the present?

Ken Jennings Launches Transit Web Series
The Jeopardy champ wants you to ride public transit.

BLM To Rescind Public Lands Rule
The change will downgrade conservation, once again putting federal land at risk for mining and other extractive uses.

Indy Neighborhood Group Builds Temporary Multi-Use Path
Community members, aided in part by funding from the city, repurposed a vehicle lane to create a protected bike and pedestrian path for the summer season.
Urban Design for Planners 1: Software Tools
This six-course series explores essential urban design concepts using open source software and equips planners with the tools they need to participate fully in the urban design process.
Planning for Universal Design
Learn the tools for implementing Universal Design in planning regulations.
Clanton & Associates, Inc.
Jessamine County Fiscal Court
Institute for Housing and Urban Development Studies (IHS)
City of Grandview
Harvard GSD Executive Education
Toledo-Lucas County Plan Commissions
Salt Lake City
NYU Wagner Graduate School of Public Service