


Part infographic and part diary, the weather radials project tracks the weather for every day in 2013.
German designer Timm Kekeritz created an innovative way to visualize the weather we lived through in 2013. Ana Swanson describes his creation, weather radials, as maps of the weather with "365 lines, each representing one day of the year, arranged clockwise in chronological order. The lines run from the daily low to the daily high temperature; the closer the line is to the center of the circle, the colder the temperature of the day. The color represents the daily mean temperature, while precipitation is represented as a larger blue circle that surrounds the temperature line."
The project includes Seattle, Chicago, Toronto, Washington D.C., New York City, San Francisco, Los Angeles, Mexico City, Austin, and Miami among cities from around the world.
FULL STORY: This graphic designer created a beautiful new way of visualizing the year in weather

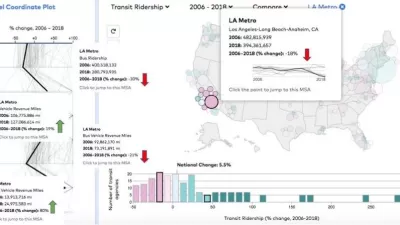
'Transit Insights' Updated With New Features for Visualizing Public Transit Data
One of the best tools for understanding the consequences and potential of transit planning has been recently updated.

Remembering the Weather of Winters Past
The measurable effects of climate change are a tangible reminder of trends over time that otherwise can be hard to recall.

Mapping the Land Uses of the United States
The McHarg Center's "The 2100 Project: An Atlas for the Green New Deal" provides a series of maps an infographics to illustrate the way the United States uses land.

Alabama: Trump Terminates Settlements for Black Communities Harmed By Raw Sewage
Trump deemed the landmark civil rights agreement “illegal DEI and environmental justice policy.”

Study: Maui’s Plan to Convert Vacation Rentals to Long-Term Housing Could Cause Nearly $1 Billion Economic Loss
The plan would reduce visitor accommodation by 25% resulting in 1,900 jobs lost.

Planetizen Federal Action Tracker
A weekly monitor of how Trump’s orders and actions are impacting planners and planning in America.

Wind Energy on the Rise Despite Federal Policy Reversal
The Trump administration is revoking federal support for renewable energy, but demand for new projects continues unabated.

Passengers Flock to Caltrain After Electrification
The new electric trains are running faster and more reliably, leading to strong ridership growth on the Bay Area rail system.

Texas Churches Rally Behind ‘Yes in God’s Back Yard’ Legislation
Religious leaders want the state to reduce zoning regulations to streamline leasing church-owned land to housing developers.
Urban Design for Planners 1: Software Tools
This six-course series explores essential urban design concepts using open source software and equips planners with the tools they need to participate fully in the urban design process.
Planning for Universal Design
Learn the tools for implementing Universal Design in planning regulations.
Caltrans
Smith Gee Studio
Institute for Housing and Urban Development Studies (IHS)
City of Grandview
Harvard GSD Executive Education
Toledo-Lucas County Plan Commissions
Salt Lake City
NYU Wagner Graduate School of Public Service