


Data journalism site FiveThirtyEight wades into the complex world of transit ridership data, looking for insights into which cities make use of robust transit systems, and which still have work to do.
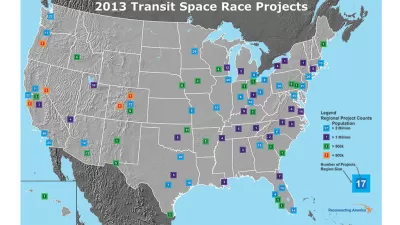
Reuben Fischer-Baum analyzes monthly ridership data from the National Transit Database and population estimates from the American Community Survey to calculate 'trips per resident" for 290 urbanized areas. The metric allows a comparison of transit trips between cities of varying sizes.
One of the larger questions examined by the article in reaction to the data follows: "Do certain regions tend to support better public transit, or is this just a product of city size and density?" Here's how Fischer-Baum responds:
"Among all 290 cities, there’s a clear relationship between trips per resident and both total population (the r-squared is 0.41) and population density (r-squared = 0.21). This means that it’s not particularly revealing to map all the cities together, because larger, denser cities are clustered in the Northeast and on the West Coast. But if we look only at the 248 urban areas with fewer than 1 million residents, the total population relationship (r-squared = 0.0002) and population density relationship (r-squared = 0.07) disappear."
FULL STORY: How Your City’s Public Transit Stacks up


Bike Share Lessons From the Pandemic
Bike share data from six U.S. cities offer insight into how Americans have changed travel patterns during the pandemic.

Transit Ridership Dropping Due to Coronavirus; Long-Term Funding Consequences Feared
The effects of a global pandemic on American shores are beginning to emerge for public transit systems. The consequences of a drop in transit ridership could extend beyond the end of the pandemic.
U.S. Transit Ridership Growing Again
The growth in transit rips in the United States over the course of the second and third quarters of 2019 can be traced to growth in two key cities.

Alabama: Trump Terminates Settlements for Black Communities Harmed By Raw Sewage
Trump deemed the landmark civil rights agreement “illegal DEI and environmental justice policy.”

Planetizen Federal Action Tracker
A weekly monitor of how Trump’s orders and actions are impacting planners and planning in America.

The 120 Year Old Tiny Home Villages That Sheltered San Francisco’s Earthquake Refugees
More than a century ago, San Francisco mobilized to house thousands of residents displaced by the 1906 earthquake. Could their strategy offer a model for the present?

Housing Vouchers as a Key Piece of Houston’s Housing Strategy
The Houston Housing Authority supports 19,000 households through the housing voucher program.

Rural Population Grew Again in 2024
Americans continued to move to smaller towns and cities, resulting in a fourth straight year of growth in rural areas.

Safe Streets Grants: What to Know
This year’s round of Safe Streets for All grant criteria come with some changes.
Urban Design for Planners 1: Software Tools
This six-course series explores essential urban design concepts using open source software and equips planners with the tools they need to participate fully in the urban design process.
Planning for Universal Design
Learn the tools for implementing Universal Design in planning regulations.
Clanton & Associates, Inc.
Jessamine County Fiscal Court
Institute for Housing and Urban Development Studies (IHS)
City of Grandview
Harvard GSD Executive Education
Toledo-Lucas County Plan Commissions
Salt Lake City
NYU Wagner Graduate School of Public Service