


In what may be the most informative piece of pointillist 'painting' ever made, a demographic researcher has created a zoomable racial map of America made up of 308,745,538 dots. The result is 'strangely beautiful'.
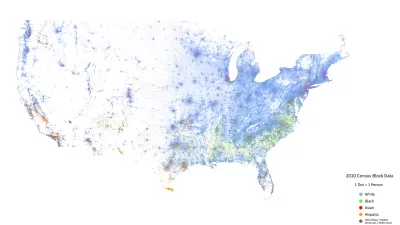
"Demographic researcher Dustin Cable's Racial Dot Map is staggering both visually and statistically," writes Emily Badger. "From afar, the most racially diverse pockets of the United States appear like blended watercolors in shades of purple and teal. Zoom all the way in, though, and each dot represents a single person, all 308,745,538 of us."
"Cable, a researcher with the the University of Virginia's Weldon Cooper Center for Public Service, has modeled the project on a previous MIT map plotting population density by individual dots," she explains. "Cable's version color-codes the results by race and ethnicity, producing an eerily beautiful picture of American segregation (and, less frequently, integration) that tricks the eye at different scales.
FULL STORY: A Strangely Beautiful Map of Race in America


America's Residential Segregation is Getting Worse
New research shows growing segregation over the last two decades in the majority of large metropolitan areas.
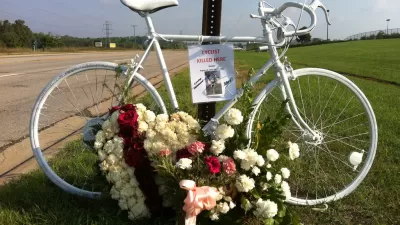
Op-Ed: Street Safety Is a Matter of Race
What do traffic safety and gun violence have in common? A lot, as it turns out. In both cases, hard-hit neighborhoods tend to have suffered from historical disinvestment along racial lines.

Study: Integrated Neighborhoods More Common Across the U.S.
A Harvard study suggests that since 2000, the number of Americans living in racially integrated neighborhoods has risen. But this may be a temporary effect of gentrification, and integration remains an exception to the rule.

Alabama: Trump Terminates Settlements for Black Communities Harmed By Raw Sewage
Trump deemed the landmark civil rights agreement “illegal DEI and environmental justice policy.”

Planetizen Federal Action Tracker
A weekly monitor of how Trump’s orders and actions are impacting planners and planning in America.

The 120 Year Old Tiny Home Villages That Sheltered San Francisco’s Earthquake Refugees
More than a century ago, San Francisco mobilized to house thousands of residents displaced by the 1906 earthquake. Could their strategy offer a model for the present?

Indy Neighborhood Group Builds Temporary Multi-Use Path
Community members, aided in part by funding from the city, repurposed a vehicle lane to create a protected bike and pedestrian path for the summer season.

Congestion Pricing Drops Holland Tunnel Delays by 65 Percent
New York City’s contentious tolling program has yielded improved traffic and roughly $100 million in revenue for the MTA.

In Both Crashes and Crime, Public Transportation is Far Safer than Driving
Contrary to popular assumptions, public transportation has far lower crash and crime rates than automobile travel. For safer communities, improve and encourage transit travel.
Urban Design for Planners 1: Software Tools
This six-course series explores essential urban design concepts using open source software and equips planners with the tools they need to participate fully in the urban design process.
Planning for Universal Design
Learn the tools for implementing Universal Design in planning regulations.
Clanton & Associates, Inc.
Jessamine County Fiscal Court
Institute for Housing and Urban Development Studies (IHS)
City of Grandview
Harvard GSD Executive Education
Toledo-Lucas County Plan Commissions
Salt Lake City
NYU Wagner Graduate School of Public Service