


After moving toward Democrats for decades, central cities moved toward Republicans in 2020.

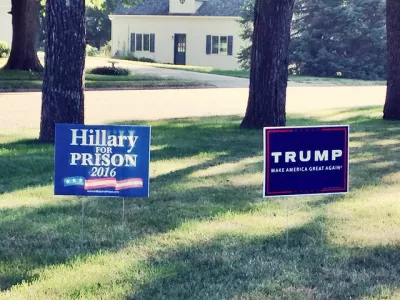
After the 2016 election, one common press narrative was that the United States is more divided than ever between Democratic cities and Republican suburbs and/or rural areas. This narrative had some basis in reality: for decades, urban cores have been steadily becoming more Democratic, while rural areas became more Republican. For example, in 1960 41 percent of San Francisco voters supported Richard Nixon, while in 2016 only 9 percent of its voters supported Donald Trump. In Philadelphia, the Republican vote share plunged from 32 percent to just over 15 percent.
A recent article published by FiveThirtyEight states: "the political gap between rural and urban America appears to have been even more pronounced this year than it was in 2016." And if you define suburbs as "urban" places, this may be true. For example, Trump lost* traditionally Republican Jacksonville, Florida, an 800-mile square mass that is mostly sprawl. But in more compact urban cores, Trump actually improved slightly on his 2016 performance.
For example:
- In Boston, Trump’s vote share increased from 13.7 percent in 2016 to 15.6 percent in 2020. By contrast, in suburban Norfolk County his vote share went down from 32.6 percent to 30.7 percent.
- In San Francisco, Trump's vote share increased from 9.2 percent to 12.7 percent.
- In New York City, Trump gained support in the city's four most urban boroughs: his vote share increased from 9.5 percent to 15.6 percent in the Bronx, from 17.5 percent to 22 percent in Brooklyn, from 21.8 percent to 26.7 percent in Queens, and from 9.7 percent to 12.1 percent in Manhattan. (In suburb-ish Staten Island, he won but his vote share was about the same as in 2016).
- In Philadelphia, Trump's vote share increased from 15.3 percent to 17.9 percent. By contrast, his vote share decreased not just in suburban counties such as Chester and Montgomery Counties, but also in Allegheny County (which includes both the city of Pittsburgh and numerous suburbs).
- In Washington, D.C., Trump's share increased from 4.1 percent to 5.4 percent.
- In Chicago, his share increased from 12.4 percent to 15.8 percent.
- In Detroit, Trump's support almost doubled; he got 12,000 votes, up from 7,000 in 2016. By contrast, Joe Biden got fewer votes than Hillary Clinton. (On the other hand, Trump’s vote share was still an anemic 5 percent- up from 3 percent in 2016). By contrast, Trump’s support continued to decline in suburban Oakland County.
- Even in Baltimore, a city that Trump called a "rodent infested mess," Trump's vote share held steady in the 10-11 percent range. By contrast, in suburban Baltimore County, Trump's share declined from 38.3 percent to just over 35 percent.
What's changed between 2016 and 2020? First of all, some polls suggest that Trump appears to have generally increased his vote share among Black and Hispanic voters, while losing college-educated whites. Although precinct-by-precinct data is not yet easy to find, these polls seem to have been accurate in at least some cities. In Philadelphia, Trump gained votes in low-income Hispanic and Black precincts of North Philadelphia, while Joseph Biden gained votes in yuppified Central City and Manayunk. Similarly, in Boston, Trump lost votes in affluent areas near downtown, but gained votes in multiracial, working-class areas at the city's southeastern edge.
Why did Trump do better in these nonwhite urban neighborhoods? It seems to me that possible explanations fall into two general camps: the "positive attraction" camp and the "negative attraction" camp. The first set of explanations suggests that these groups liked Trump more than in 2020, and might have swung to him no matter what Democrats did. Perhaps working-class voters of color, like white working-class voters, like Trump’s personal style, or are grateful for the pre-COVID-19 economic recovery, or perhaps were they were less hostile to Trump than in 2016 because he focused less than usual on racially charged immigration-related issues.
"Negative attraction" explanations focus on the deficiencies of Democrats. One might argue that as the Democrats have become a party of upper-middle-class whites, working-class nonwhites are beginning to join working-class whites in being displeased with the Democrats' cultural liberalism and/or rising crime in Democrat-led cities. (Although interestingly, Trump did not gain many votes in St. Louis, 2020's likely murder capital.)
We should know more after next November's municipal elections, when Trump will not be on the ballot. I suspect that if the "positive attraction" explanations are true, Black and Hispanic support for Republicans will ebb when Trump is not on the ballot; by contrast, if Democrats are the problem, the GOP urban vote will grow in 2021 municipal elections and in the midterm elections. And if this is the case, the Republican Party may become multiracial over the next decade or two: good news for Republicans generally, bad news for the faction of the Republican Party that is obsessed with reducing immigration and keeping America majority-white, and even worse news for Democrats who fantasize that increased ethnic diversity would shift American politics to the left.
*Unless otherwise stated, data comes from usaelectionatlas.org
**Additionally this tweet suggests that Trump gained votes in Washington's poorest areas east of the Anacostia River, while losing votes in the city's affluent northwest side.
Feb. 2021 Postscript: the New York Times issued precinct-by-precinct data for most U.S. cities; most of what I read seems consistent with what I wrote above.


The Environment Hangs in the Balance on Election Day
Both the presidential election and numerous state and local ballot measures will determine the future of environmental policy in the United States.
Petition Seeks Landmark Status for Philadelphia's Four Seasons
Four Seasons Total Landscaping. Was that not clear?
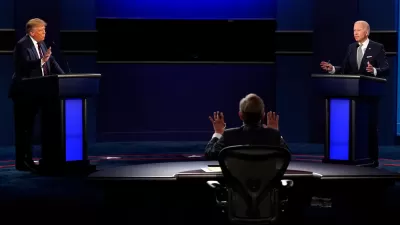
What Biden's Win Could Mean for Land Use, Transportation, and Climate
Campaign in poetry and govern in prose, the saying goes. Now that the reality of a Biden presidency is settling in, what does it mean for how the United States plans its future?

Alabama: Trump Terminates Settlements for Black Communities Harmed By Raw Sewage
Trump deemed the landmark civil rights agreement “illegal DEI and environmental justice policy.”

Planetizen Federal Action Tracker
A weekly monitor of how Trump’s orders and actions are impacting planners and planning in America.

Why Should We Subsidize Public Transportation?
Many public transit agencies face financial stress due to rising costs, declining fare revenue, and declining subsidies. Transit advocates must provide a strong business case for increasing public transit funding.

Understanding Road Diets
An explainer from Momentum highlights the advantages of reducing vehicle lanes in favor of more bike, transit, and pedestrian infrastructure.

New California Law Regulates Warehouse Pollution
A new law tightens building and emissions regulations for large distribution warehouses to mitigate air pollution and traffic in surrounding communities.

Phoenix Announces Opening Date for Light Rail Extension
The South Central extension will connect South Phoenix to downtown and other major hubs starting on June 7.
Urban Design for Planners 1: Software Tools
This six-course series explores essential urban design concepts using open source software and equips planners with the tools they need to participate fully in the urban design process.
Planning for Universal Design
Learn the tools for implementing Universal Design in planning regulations.
Caltrans
Smith Gee Studio
Institute for Housing and Urban Development Studies (IHS)
City of Grandview
Harvard GSD Executive Education
Toledo-Lucas County Plan Commissions
Salt Lake City
NYU Wagner Graduate School of Public Service