


The New York Times illustrates the scope and scale of the great project still facing the United States: to decrease greenhouse gas emissions from the transportation sector of its economy.
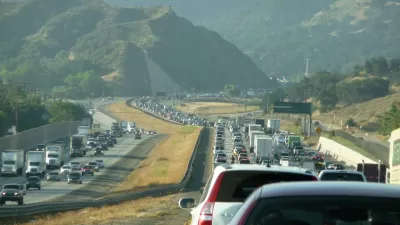
"Transportation is the largest source of planet-warming greenhouse gases in the United States today and the bulk of those emissions come from driving in our cities and suburbs."
So reads the introduction to an interactive map published by The New York Times, claiming to be the most detailed map of auto emissions in the United States, using data from Boston University's Database of Road Transportation Emissions.
"Even as the United States has reduced carbon dioxide emissions from its electric grid, largely by switching from coal power to less-polluting natural gas, emissions from transportation have remained stubbornly high," write Nadja Popovich and Denise Lu in the article that runs alongside the interactive map.
"The bulk of those emissions, nearly 60 percent, come from the country’s 250 million passenger cars, S.U.V.s and pickup trucks, according to the Environmental Protection Agency. Freight trucks contribute an additional 23 percent."
The article discusses the state of environmental regulation as the transition between the Obama and Trump administrations begins to have consequential outcomes for the nation's environmental policies. The article also teases out some of the geographic distinctions illustrated by the map:
Boston University’s emissions database, first published in 2015 and updated this week with an additional five years of data, reveals that much of the increase in driving-related CO2 has occurred in and around cities.
New York City and Los Angeles lead the country in terms of the total number of emissions—in line with those cities' positions as the two most populous in the country. Emissions in both cities, however, have grown significantly since 1990.
The map isn't the only interactive graphic included in the article, and Los Angeles and New York City are far from the only cities with growing emissions, measured both by total and per capita.
FULL STORY: The Most Detailed Map of


LA’s Trees Absorb More Carbon Than Expected, But Can’t Do It Alone
A USC study finds that Los Angeles’ urban trees absorb more carbon than expected, but while they provide crucial environmental benefits, they cannot replace the urgent need for systemic emissions reductions.
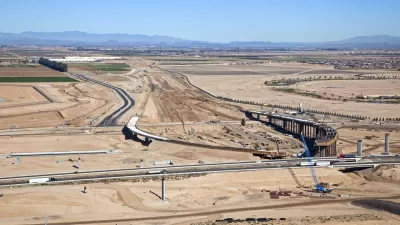
Infrastructure Funding Could Lead to Higher Carbon Emissions
Billions in federal infrastructure funding slated to go to states with few strings attached could fund roadway construction and widening projects that will raise greenhouse gas emissions and worsen climate change.

Assessing Prince George's County's Climate Action Plan
The Prince George's County draft Climate Action Plan includes ambitious goals and timetables, but falls short of recommended targets for emissions reductions in the transportation sector.

Alabama: Trump Terminates Settlements for Black Communities Harmed By Raw Sewage
Trump deemed the landmark civil rights agreement “illegal DEI and environmental justice policy.”

Planetizen Federal Action Tracker
A weekly monitor of how Trump’s orders and actions are impacting planners and planning in America.

The 120 Year Old Tiny Home Villages That Sheltered San Francisco’s Earthquake Refugees
More than a century ago, San Francisco mobilized to house thousands of residents displaced by the 1906 earthquake. Could their strategy offer a model for the present?

Ken Jennings Launches Transit Web Series
The Jeopardy champ wants you to ride public transit.

BLM To Rescind Public Lands Rule
The change will downgrade conservation, once again putting federal land at risk for mining and other extractive uses.

Indy Neighborhood Group Builds Temporary Multi-Use Path
Community members, aided in part by funding from the city, repurposed a vehicle lane to create a protected bike and pedestrian path for the summer season.
Urban Design for Planners 1: Software Tools
This six-course series explores essential urban design concepts using open source software and equips planners with the tools they need to participate fully in the urban design process.
Planning for Universal Design
Learn the tools for implementing Universal Design in planning regulations.
Clanton & Associates, Inc.
Jessamine County Fiscal Court
Institute for Housing and Urban Development Studies (IHS)
City of Grandview
Harvard GSD Executive Education
Toledo-Lucas County Plan Commissions
Salt Lake City
NYU Wagner Graduate School of Public Service