


The recent spill of 210,000 gallons of crude oil from the Keystone pipeline in South Dakota was far from an outlier.
Jonathan Thompson follows the news from earlier in the week that the Nebraska Public Service Commission had authorized the Keystone XL oil pipeline through the state by presenting on infographic that illustrates the scale of the environmental threat represented by oil pipelines.
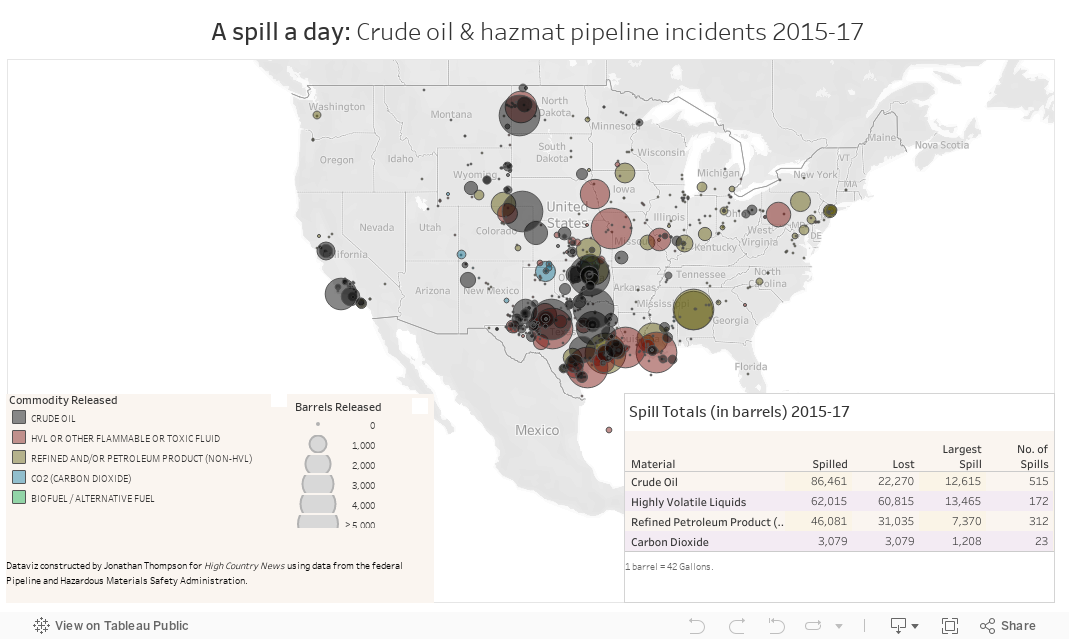
"Pipelines are often touted as safer than train or truck for transporting oil and other hazardous materials. But over the last two-and-a-half years, crude oil and hazardous materials pipelines across the U.S. busted at a rate of more than once per day, through corrosion, floods, lightning, vehicles and vandals," writes Thompson.
"Some 3.6 million gallons of crude oil spilled in total, and five oil spills were as large or larger than the Keystone incident," writes Thompson, referring to an incident earlier in November that spilled 5,000 barrels, or 210,000 gallons, of crude oil from the Keystone Pipeline in South Dakota.
To illustrate this point, Thompson also shares the infographic shown below, which gathers all the crude oil spills between 2015 and 2017 onto one busy map of the United States.
FULL STORY: Nationwide, oil pipeline spills are a near-daily reality

Tar Sands Oil Just Lost Another Outlet, For Now
It was viewed as a "David vs. Goliath" pipeline fight: the city of South Portland, Maine against a pipeline company backed by Big Oil. The city had passed a zoning ordinance preventing the export of oil which would have impacted public health.
Keystone Pipeline Leaks Oil in Advance of Crucial Decision on Sister Pipeline
Thursday's massive oil spill in South Dakota is not a good omen for TransCanada for a favorable decision on Monday on an application before the Nebraska Public Service Commission on the routing of the controversial Keystone XL pipeline.
The Geography of Oil and Gas Pipeline Accidents [Updated]
Safety is one trigger in the heated debate over whether fossil fuels should be transported by pipeline. While the industry insists the method is safer than others, the spread of accidents since 1986 is substantial.

Study: Maui’s Plan to Convert Vacation Rentals to Long-Term Housing Could Cause Nearly $1 Billion Economic Loss
The plan would reduce visitor accommodation by 25,% resulting in 1,900 jobs lost.
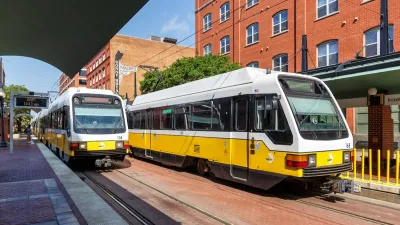
North Texas Transit Leaders Tout Benefits of TOD for Growing Region
At a summit focused on transit-oriented development, policymakers discussed how North Texas’ expanded light rail system can serve as a tool for economic growth.

Why Should We Subsidize Public Transportation?
Many public transit agencies face financial stress due to rising costs, declining fare revenue, and declining subsidies. Transit advocates must provide a strong business case for increasing public transit funding.
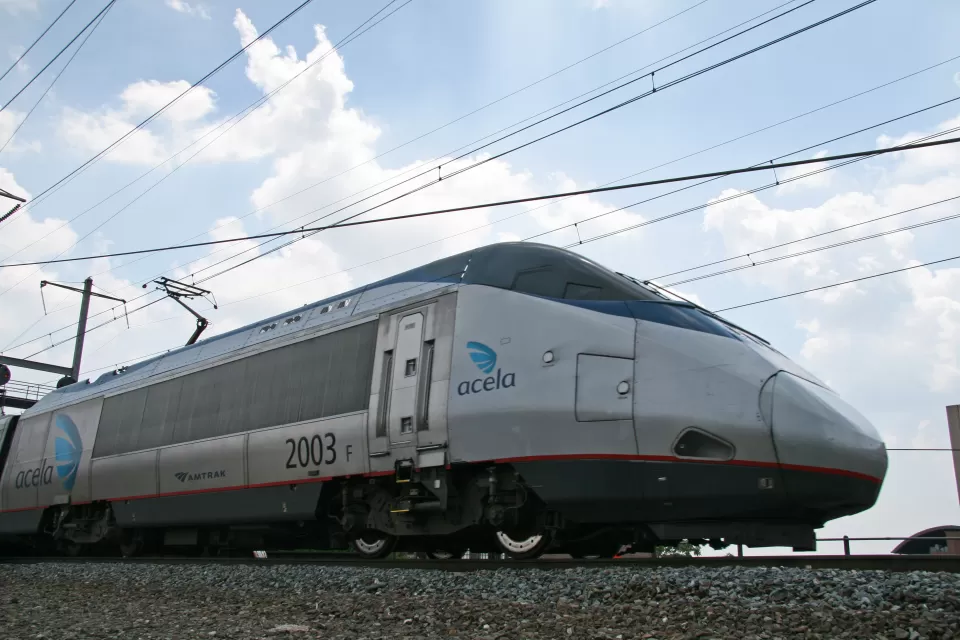
How to Make US Trains Faster
Changes to boarding platforms and a switch to electric trains could improve U.S. passenger rail service without the added cost of high-speed rail.

Columbia’s Revitalized ‘Loop’ Is a Hub for Local Entrepreneurs
A focus on small businesses is helping a commercial corridor in Columbia, Missouri thrive.

Invasive Insect Threatens Minnesota’s Ash Forests
The Emerald Ash Borer is a rapidly spreading invasive pest threatening Minnesota’s ash trees, and homeowners are encouraged to plant diverse replacement species, avoid moving ash firewood, and monitor for signs of infestation.
Urban Design for Planners 1: Software Tools
This six-course series explores essential urban design concepts using open source software and equips planners with the tools they need to participate fully in the urban design process.
Planning for Universal Design
Learn the tools for implementing Universal Design in planning regulations.
City of Santa Clarita
Ascent Environmental
Institute for Housing and Urban Development Studies (IHS)
City of Grandview
Harvard GSD Executive Education
Toledo-Lucas County Plan Commissions
Salt Lake City
NYU Wagner Graduate School of Public Service