


A cautionary tale of using indices.
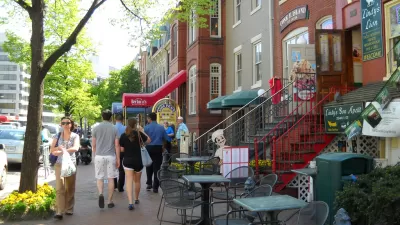
Have you ever plugged your address into a popular real estate tool to see what your house is worth and been surprised by the neighborhood’s ‘walkability score?’ Or noticed a walk score telling you that the neighborhood you’re interested in is a “walker’s paradise” only to notice that it’s actually made up of wide arterial roads and vast parking lots?
You aren’t alone. Indices like the EPA’s Walkability Score or the CalEnviroScreen Index, are popular tools for researchers, policymakers, planners, and local organizations trying to assess their local transportation and land use systems. But they don’t tell the whole story. Overreliance on indices like these can leave out valuable and important information for community planning and policy making. Having worked with communities conducting community-focused transportation needs assessments, we’ve seen firsthand how relying on a single metric can mask or overshadow actual on-the-ground conditions. High walk scores in many communities are incongruent with on-the-ground data collection such as walk audits or crowdsourcing that highlight safety concerns, pedestrian difficulties, uncut curbs, dangerous intersections that are unlit or poorly lit without stop signs, or the lack of a reliable sidewalk network to get them where they need to go.
Indices are popular for one particularly good reason: they are simple, albeit deceptively so. They require little effort or training to use. By offering up a single number, they provide the user with a quick snapshot to compare one thing against another. On the surface, this is intuitive and easy to understand. An index can be useful when the specific determinants of an outcome vary across places. One city’s housing market might be constrained by a very different list of rules and regulations than another. A scholar interested in comparing housing supply across places could use an index that includes several different regulatory constraints to identify the extent to which policy choices, broadly, are restricting supply.
As simple as indices appear on the outside, it is quite a different thing to decipher them. By its very nature, an index combines and weighs multiple measures into one, masking the impact of any single measure and potentially hiding biases toward more heavily weighted factors.Take the Walkability score example. Walkability indices might, on average, indicate places where more people walk for transport rather than pleasure. In very broad strokes, they also offer a proxy for urban attributes: places with more destinations and paved pathways score higher. For example, the index uses shorter distances to transit stops as a variable to correlate to more walking trips. This leads to higher walkability rankings in the index for locations with higher density and transit stops.
Yet the index falls short as a way to diagnose a place’s transportation system and prioritize projects. The results can often overlook the ease of access for individuals and do little to illuminate the mobility needs of a community. A place with a high mix of land uses, a high density of intersections, and many transit stops might still have dangerous intersections that result in a high number of pedestrian injuries even when walking distances to transit are short and a place is otherwise indexed as highly walkable. This may reflect a lack of accounting for scale or a missing variable: while a block group might be ranked as very walkable, there could still be pockets with very dangerous intersections and the indicators used to construct the index may vary.
Walkability indices vary as they can prioritize how quickly people can get to their destinations—with distance and time to transit, or proximity to destinations—or they can include more subjective measures. The Walkability Index is a composite of indicators that include the mix of employment types (retail, office, industrial), the mix of employment and housing, the proportion of commuters that carpool, and the density of intersections. A walkability score might not factor in how dangerously drivers behave in a place, the presence or absence of pedestrian infrastructure such as well-marked crosswalks, and how many drivers collide with vulnerable road users. Moreover, many factors that affect whether a place is considered walkable or not are difficult, though not impossible, to measure. Some aspects of the built environment, such as curb cuts or broken sidewalks, are small but significant barriers to safe travel. Others, like large surface parking lots, may not be dangerous per se but can make for a dreary and unshaded walking route.
Another consideration: the weighting of variables in an index matters. Knowing which factor most impacts transportation barriers is necessary to creating relevant transportation policies. Consider the CalEnviroScreen Index, a tool California uses to identify “disadvantaged communities” and fund projects that aim to reduce greenhouse gas emissions. The index includes 21 indicators that cover a range of socioeconomic, public health, and environmental indicators. A high score on the index might tell you where some of the state’s most polluted air quality and dirtiest groundwater are located. It might also tell you where the housing burden or unemployment rate is highest. It might not tell you where a specific population is suffering from a specific issue. Take, for example, a census tract just south of downtown Redding, California. It ranks in the top 20 percent for asthma rates in the state, likely due to the high levels of diesel particulate matter in the area, which is located next to a major highway. Yet its overall CalEnviroScreen Index score is only in the high 40s, boasting one of the lowest pollution burden scores in the state. Using just the overall score obscures the high rates of asthma and the impact of the nearby highway on the community.
It’s important to understand what an index is meant to be and when it should (or shouldn’t) be used. An index won’t tell you how to intervene with a specific policy. Indices are meant to be a guide and point out generalized patterns. Indices are present across all industries, assessing everything from consumer confidence to the stock market or how happy people are in different countries. But just because you live in a country with a low happiness score doesn’t mean you’re personally unhappy. And just because you live in a community with a high walk score doesn’t mean you can easily get to where you need to go on foot.
As such, we caution against translating an index result into policy. For example, an area with a high score on the Transportation Insecurity Index could mean that a lot of residents are concerned with safety or reliability in their transportation system, that many people feel embarrassed that they don’t have reliable transportation, or that a lot of people don’t have access to a private vehicle. But what does the score tell you? Is the problem that you don’t have a car, or are you embarrassed that you don’t have one? What matters is that you still don’t have a car.
All of this is to say that indices, while useful as a general tool, yield little information for very specific cases and don’t tell the whole story. Read them cautiously, triangulate your analysis with additional data sources, talk to your community and neighbors, and be skeptical of policy inferences people draw from indices alone.
Miriam Pinski, PhD is a Research Analyst for the Shared Use Mobility Center (SUMC). Lauren N. McCarthy is Director and Strategic Lead, California and Western States Programs for SUMC.


What the ‘Walk Score’ Misses
A popular walkability assessment omits key factors that impact different demographics and can direct development resources to already wealthy neighborhoods.
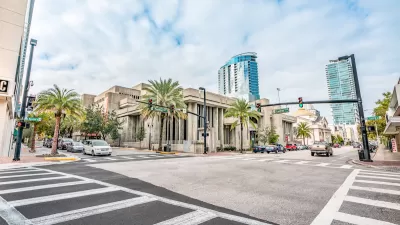
Orlando Pledges to Improve Walkability
A city report highlights successes and failures in building safer transportation infrastructure and reducing VMT in 2023.

Green Spaces Benefit Neighborhoods—When Residents can Reach Them
A study comparing green space and walkability scores found that, without effective access to local parks, residents of greener neighborhoods don’t reap the health benefits.

Alabama: Trump Terminates Settlements for Black Communities Harmed By Raw Sewage
Trump deemed the landmark civil rights agreement “illegal DEI and environmental justice policy.”

Study: Maui’s Plan to Convert Vacation Rentals to Long-Term Housing Could Cause Nearly $1 Billion Economic Loss
The plan would reduce visitor accommodation by 25% resulting in 1,900 jobs lost.

Planetizen Federal Action Tracker
A weekly monitor of how Trump’s orders and actions are impacting planners and planning in America.

Waymo Gets Permission to Map SF’s Market Street
If allowed to operate on the traffic-restricted street, Waymo’s autonomous taxis would have a leg up over ride-hailing competitors — and counter the city’s efforts to grow bike and pedestrian on the thoroughfare.

Parklet Symposium Highlights the Success of Shared Spaces
Parklets got a boost during the Covid-19 pandemic, when the concept was translated to outdoor dining programs that offered restaurants a lifeline during the shutdown.

Federal Homelessness Agency Places Entire Staff on Leave
The U.S. Interagency Council on Homelessness is the only federal agency dedicated to preventing and ending homelessness.
Urban Design for Planners 1: Software Tools
This six-course series explores essential urban design concepts using open source software and equips planners with the tools they need to participate fully in the urban design process.
Planning for Universal Design
Learn the tools for implementing Universal Design in planning regulations.
Caltrans
Smith Gee Studio
Institute for Housing and Urban Development Studies (IHS)
City of Grandview
Harvard GSD Executive Education
Toledo-Lucas County Plan Commissions
Salt Lake City
NYU Wagner Graduate School of Public Service