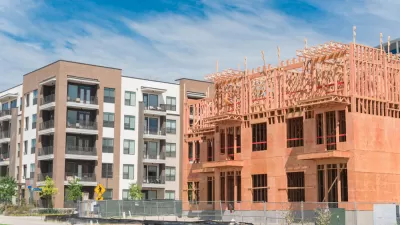
Yes, Americans are moving a lot less, but why? In this part of my post, I drill down to try to unearth some of the reasons. It turns out they're complicated.

In Part One of this post, I argued that the Big Theory that “the progressives froze the American dream” is both tendentious and untrue. But demolishing a bad theory is much less interesting than trying to figure out what’s actually going on. So, in this post I plan to drill down into the numbers to see what they have to say. It turns out housing undersupply is in the mix, but it’s only one of many things that have driven the drop in mobility.
Leaving aside international migration, people move for a lot of different reasons. Moves that take place within the same city or county account for about two-thirds of all moves, and mostly have to do with changes in housing (find a better home or neighborhood, buy rather than rent) or family status (marriage, separation, divorce, empty nest). Most moves made in the hope or expectation of a better job or other opportunity fall outside people’s current home county, in the same or a different state. Those moves account for about one-third of moves. Even there, though, many people move to other areas for reasons unrelated to work or opportunity. Still, we can look at that group — defined by people who move to a different county or state — as “opportunity moves.”
Let’s look at what is actually happening with those moves, and then try to understand why it’s happening.
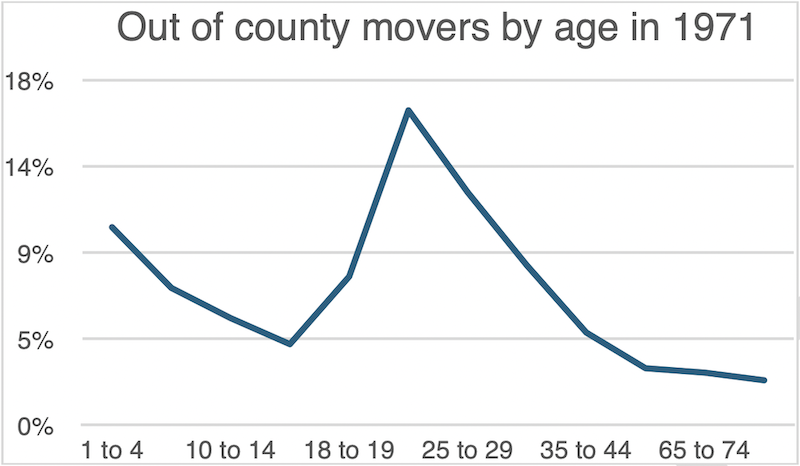
The best way to do that is to break down moves by the age of the mover. The data breaks down out-of-county moves by age group. We know one reason why mobility has declined is that America’s population is getting older, and that – notwithstanding popular tropes about older people moving to Florida - older people move much less than young people. That, in and of itself, has significantly reduced American mobility. But let’s see what happens if we control for age. First, let’s look at the historical trend – what percentage of the people in each age group moved in 1971. Nearly 70 percent of movers were people in their 20s along with their small children. And yes, few people move once they pass their mid-40s.
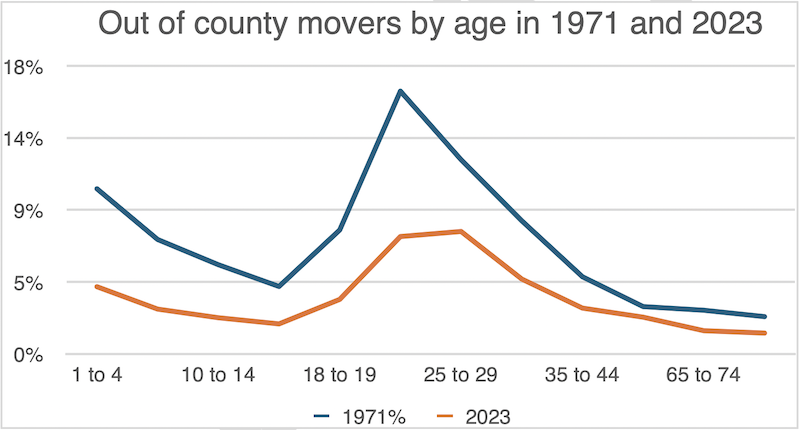
Now let’s compare the same statistic for 2023. As we expected, there’s a big difference. And while it’s still mostly young people who are moving, they moved a lot less than they did in 1971.
But it gets more interesting. Now, lets add 2000 to the mix. When we control for age group, it turns out that there’s virtually no difference in out-of-county mobility from 1971 to 2000! The only difference of any significance is a drop in the 20 to 24 age group, which may have to do with a greater tendency of college graduates to stay in the same city after graduating, or perhaps not. But now we know that whatever happened to mobility has basically all happened since 2000.
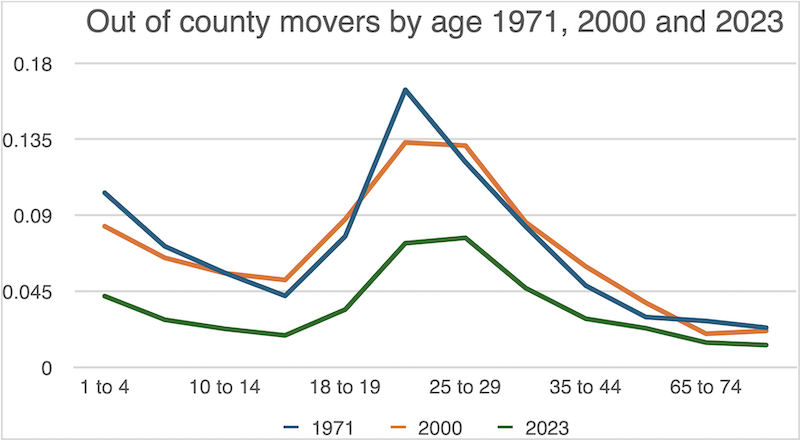
One more graph, adding 2010 to the mix. This is amazing. 2010 and 2023 mobility rates by age are basically identical. In other words, for all practical purposes, the drop in out-of-county/opportunity moves took place in one decade, between 2000 and 2010.
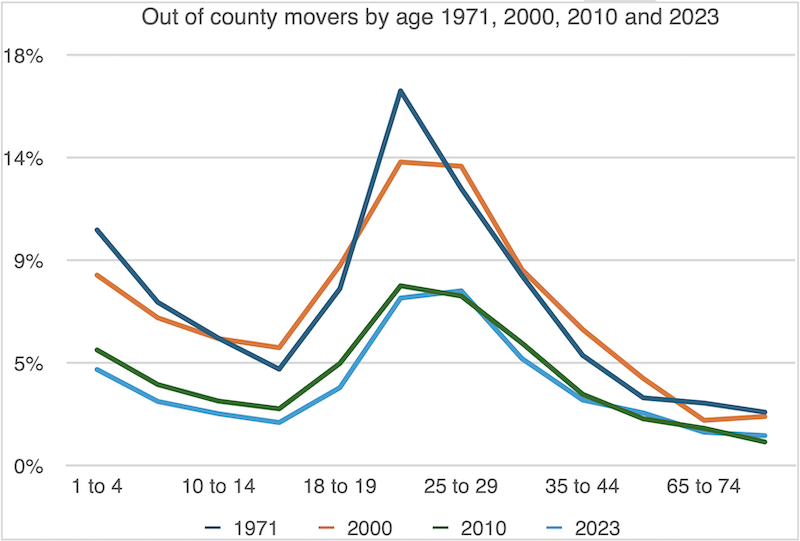
This tells us that rather than being a gradual, cumulative process, most of the decline in opportunity migration can be traced to a single trigger event. As it happens, that was the decade of the housing bubble, the foreclosure crisis and the Great Recession. While I’m not suggesting that fertility rates have a causal connection with mobility, it is notable that the Great Recession was also a crucial inflection point in American fertility, as this graph shows.
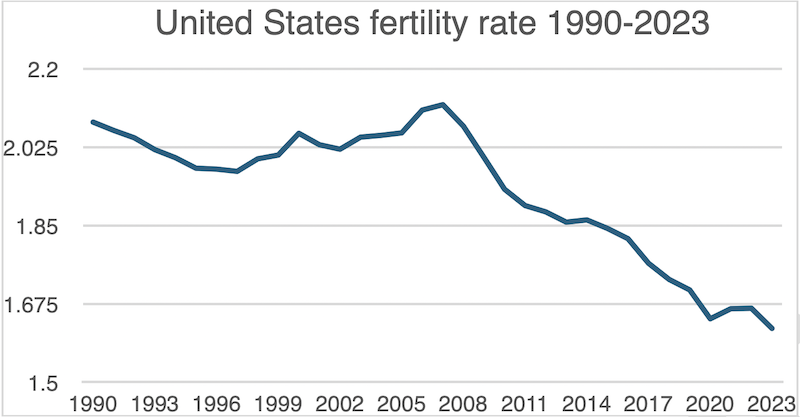
While the results are clear, why the Great Recession has had what appears to be a sustained effect on the collective American psyche is much less clear. One can speculate that the trauma of the loss of millions of homes and jobs and billions of dollars in equity translated into an underlying sense of insecurity or negativity about the future, which in turn has translated into reduced mobility, reduced childbearing, and quite possibly, shifts in political attitudes. This is speculative, of course, but there is a good deal of solid research on the long-term effects on individuals of growing up or graduating during a recession, which supports the idea. In any event, the association between the Great Recession and the decline in opportunity moves – for whatever reason – is a powerful one, and it’s more than likely that the COVID-19 pandemic has reinforced it. And, as we’ve seen with fertility rates, they don’t bounce back after the immediate crisis has ended.
A second critical factor, which I mentioned briefly in Part 1 of this post, is the vast economic gap which has grown up between America’s stronger and weaker regions, which economist Enrico Moretti calls “the Great Divergence.” In the 1960s and 1970s incomes and house values were about the same in the Rust Belt and in coastal cities like Seattle or Washington DC. The median house in both of those cities was worth about $20,000 (about $175,000 in today’s prices), the same as in Detroit and only a little more than in Cleveland. The median Detroit family earned about $10,000/year or about $87,000 in 2025 dollars, a little more than their counterparts in Washington and a little less than in Seattle or San Francisco. Moreover, house prices were reasonable relative to incomes. The median house in Detroit was worth less than double the median income, easily affordable. In Los Angeles, it was worth 3.5 times the median family income. A bit of a stretch, perhaps, but manageable.
Today, however, the median house in Los Angeles is worth nearly $900,000, or 11 times the median Los Angeles income, and 20 times the median Detroit family income. That means two things, both of which discourage mobility: the average Detroiter cannot realistically hope to move to LA and buy a home, and the average Angeleňo, if they have a home already, can’t afford to lose it, because they’d have nowhere else to go that they can afford. This is playing out tragically right at this moment with the victims of the Eaton fire in Altadena. But these are really two separate phenomena.
Something some of the supply-side hawks seem to forget is that house prices not only reflect supply, they reflect demand. And incomes have risen a lot faster in Seattle or San Francisco than in Detroit or Cleveland. Adjusted for inflation, the average family income in San Francisco or Seattle is more than double what it was in 1970. By comparison, the average Detroit family income today is only a little more than half of what it was in 1970. So, even if builders in the Bay area were able to build as many houses as they wanted to, the average Detroiter would still be out of luck, because demand from higher income households would eat up the supply. If house prices in San Francisco perfectly reflected income growth and no more, the median house would still cost over $500,000, far beyond the reach of the great majority of Detroit or Cleveland residents.
This is not really a housing issue, but one of macroeconomics. While globalization may help reduce economic disparities between China and America, it amplifies economic disparities within the US. Favored places like San Francisco, New York or Washington DC, where high-wage jobs are growing in areas like technology, finance or government lobbying get richer – much richer – and the others wilt on the vine. The trends unleashed by the economic policies that have been driving the United States and most of the rest of the world since the late 1970s or 1980s would have slowed down mobility independent of the level of housing production.
But, circling back to housing, it’s also an undersupply problem. Houses in San Francisco don’t cost $500,000, they cost over a million. That difference doesn’t have much effect on the average Detroiter’s mobility, seeing as she’s priced out anyway, but it affects the people who already live in San Francisco, and might want to move up, whether for family reasons or because they simply want a bigger, nicer house. If they want to stay in the Bay area, they are stuck. At the other end, though, if the average Detroiter wants to move up to a nicer, bigger house in her home region she will find a varied supply of houses that she can afford.
Thus, the inability of people from low-performing regions like Detroit to high-performing regions like San Francisco is not really a housing problem, it’s an economic policy problem. But the inability of a San Franciscan to move up to bigger or better housing is a housing problem, although to couch the problem as simply the product of over-regulation is an egregious oversimplification.
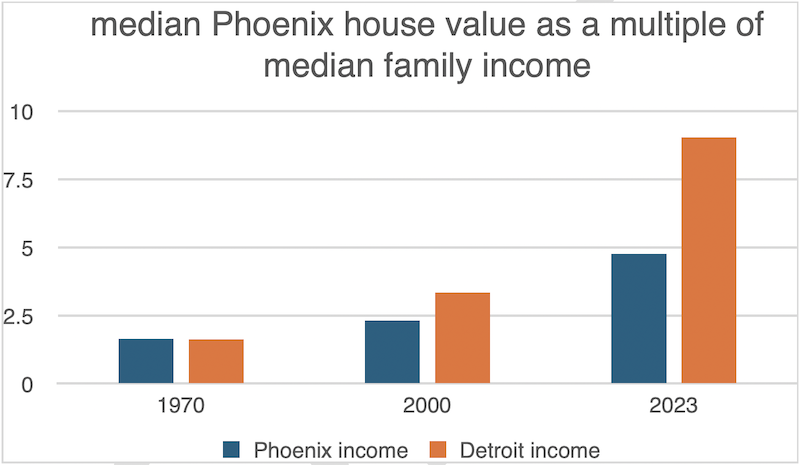
San Francisco is at the top of the scale, though, on housing costs. What happens if we look at an opportunity destination that’s more in the middle of the pack, like Phoenix? In 1970, house prices and incomes were both slightly lower in Phoenix than in Detroit, and Phoenix was a very affordable city with a house value/family income ratio of 1.6. In 2000, Phoenix was still fairly affordable both for a resident seeking to move up or a migrant from Detroit seeking greater opportunity.
Today, however, with the median Phoenix house value well north of $400,000, the picture is different. While the median resident would have to stretch herself to move up in the local housing market, with a value/income ratio of 4.8/1, it’s still an option for many. The median Detroiter, however, facing a 9/1 value/income ratio, has been effectively priced out of the Phoenix market. It’s doubtful that that’s the result of over-regulation, unless you count denying approval to a project because there’s no water available as over-regulation.
Just to add one more twist, as people familiar with real estate conditions know, a major problem with today’s housing market is the undersupply of existing homes. That, in turn, largely stems from the fact that millions of homeowners have 2.5 percent or 3 percent mortgages dating back to the late 2010s and early 2020s, and would be heavily burdened financially by buying a new house with a 6.5 percent or 7 percent mortgage. So they stay put. That means not only that they move less, but that the people who might buy their home but can’t, also move less.
There are probably other factors affecting mobility that I haven’t even gone into, like the fact that more households have two or more wage earners or job skills mismatch (people with college degrees are more likely to make opportunity moves). There are probably some things going on that no analyst has spotted yet. But the main point is clear: complicated social and economic changes in a society are driven by multiple, complicated forces. They cannot be reduced to a single factor, let alone an identifiable villain. And people who try to do so block the path to thoughtful, constructive social policy. They should be chastised, not celebrated.

Alabama: Trump Terminates Settlements for Black Communities Harmed By Raw Sewage
Trump deemed the landmark civil rights agreement “illegal DEI and environmental justice policy.”

Planetizen Federal Action Tracker
A weekly monitor of how Trump’s orders and actions are impacting planners and planning in America.

The 120 Year Old Tiny Home Villages That Sheltered San Francisco’s Earthquake Refugees
More than a century ago, San Francisco mobilized to house thousands of residents displaced by the 1906 earthquake. Could their strategy offer a model for the present?

San Francisco Opens Park on Former Great Highway
The Sunset Dunes park’s grand opening attracted both fans and detractors.

Oregon Legislature to Consider Transit Funding Laws
One proposal would increase the state’s payroll tax by .08% to fund transit agencies and expand service.

Housing Vouchers as a Key Piece of Houston’s Housing Strategy
The Houston Housing Authority supports 19,000 households through the housing voucher program.
Urban Design for Planners 1: Software Tools
This six-course series explores essential urban design concepts using open source software and equips planners with the tools they need to participate fully in the urban design process.
Planning for Universal Design
Learn the tools for implementing Universal Design in planning regulations.
Clanton & Associates, Inc.
Jessamine County Fiscal Court
Institute for Housing and Urban Development Studies (IHS)
City of Grandview
Harvard GSD Executive Education
Toledo-Lucas County Plan Commissions
Salt Lake City
NYU Wagner Graduate School of Public Service


