


Affordability is an important but often overlooked transportation planning issue. A new report provides practical guidance for evaluating transportation affordability and achieving affordability goals.

There is a serious disconnect between what travelers want and the type of transportation systems planning produce. Currently, the majority of transportation infrastructure spending is devoted to roads and parking facilities; this reflects a planning process that that prioritizes speed over other goals, and therefore faster modes over slower but more affordable, inclusive and resource-efficient modes. Yet, that is not what transportation system users want.
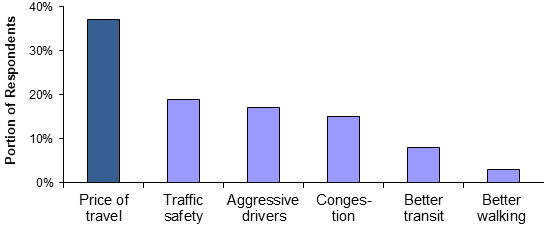
One National Household Travel Surveys asked respondents to prioritize transportation problems. It found that the highest ranking problem was not traffic congestion, crash risk, pollution or inadequate mobility options for non-drivers, the problem that users considered worst was the “Price of travel,” or what I call unaffordability, as illustrated below.
Transportation Issue Ratings
Affordability is the most overlooked and undervalued transportation planning goal. Transportation agencies have clearly defined goals, targets and performance indicators for increasing traffic speeds, reducing congestion, improving safety, reducing emissions, and sometimes for social equity, but few even mention affordability, and I've found none that have measurable targets or effective ways of evaluating whether a particular planning decisions increases or reduces overall affordability. This is a major planning failure.
My newest report, Evaluating Transportation Affordability: How Planning Can Better Respond to Demands for Lower Cost Travel, hopes to fill this gap. It provides practical guidance for incorporating affordability goals into transportation planning.
Affordability refers to the costs of goods relative to incomes, and households’ ability to purchase necessities such as food, housing and healthcare. Transportation affordability refers to households’ ability to access basic goods and activities while leaving enough money to purchase other necessities.
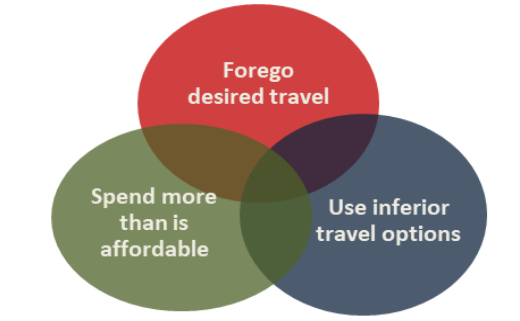
Unaffordable transportation creates problems: it forces lower-income families to forego desired travel and opportunities, use inferior — inconvenient, uncomfortable and sometimes dangerous — travel options, or spend more than they can afford on mobility, as illustrated to the right. Affordable transportation allows everybody to enjoy opportunity, freedom and happiness.
Problems of Transportation Unaffordability
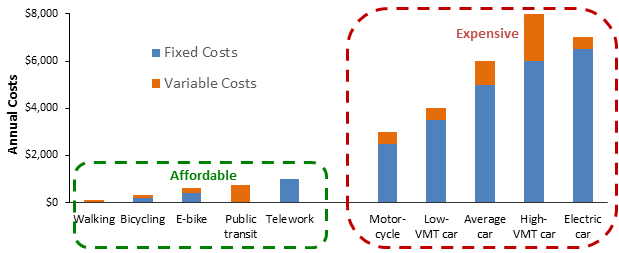
There are various ways to define and measure affordability. Experts recommend that households spend no more than 45 percent of their budgets on housing and transportation combined, which recognizes the trade-offs that families often face between housing and travel expenses. A typical family that spends 30 percent of its budget on housing can afford to spend up to 15 percent on transportation. Of course, every household has unique needs and abilities; some can spend more than these limits, but others can afford less, and even people who normally rely on higher-cost modes can benefit from having more affordable options that they or their loved-ones could use if needed in the future.
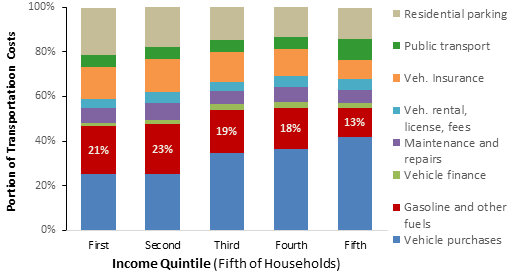
The figure below compares U.S. household transportation expenditures by cost category and income class. Although fuel costs tend to receive the most attention, they are a modest portion of the total. Most (70–80 percent) vehicle costs are fixed (not significantly affected by the amount a vehicle is driven), so once a household purchases a vehicle it has few ways to reduce its costs.
Transportation Costs by Income Class
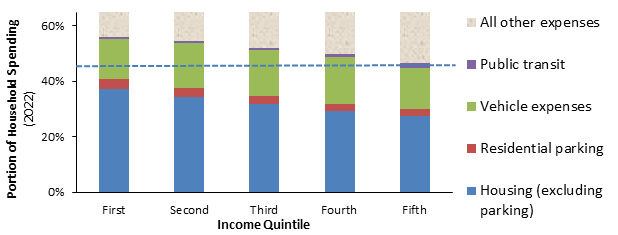
The following figures show the portion of household spending devoted to housing and transportation (H+T) by income quintile (fifth of all households). Most households spend more than 45 percent, indicated by the dashed line, which is more than is considered affordable.
H+T Expenditures by All Households
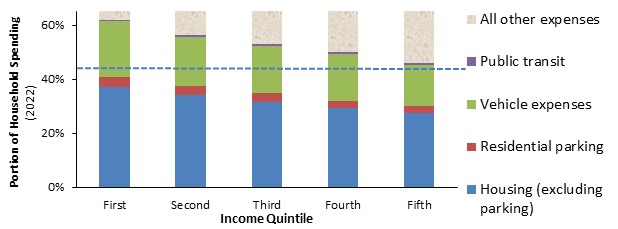
Low-income vehicle-owning households typically spend more than 20 percent of their budgets on transportation and more than 60 percent on H+T combined, as illustrated below.
H+T Expenditures by Vehicle-Owning Households
This indicates that many lower income households face severe transport costs and risks: lower-income motorists tend to bear particularly high vehicle loan, insurance and repair costs, their vehicles tend to be unreliable, and many live in automobile-dependent areas that lack non-auto travel options. This can cause absenteeism and tardiness, missed appointments, limited childcare and school options, and poor access to affordable food. If they lose their job or driving privileges, or their vehicle fails or crashes, they may face disaster: reduced income, no vehicle, lack of mobility options, ongoing vehicle payments, poor credit rating, and sometimes disabilities.
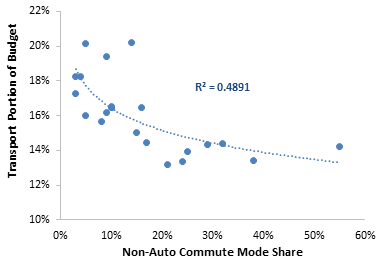
Multimodal communities have much more affordable transportation. The following graph shows that relatively small increases in non-auto mode shares tend to provide large cost savings.
Transportation Spending Versus Mode Shares
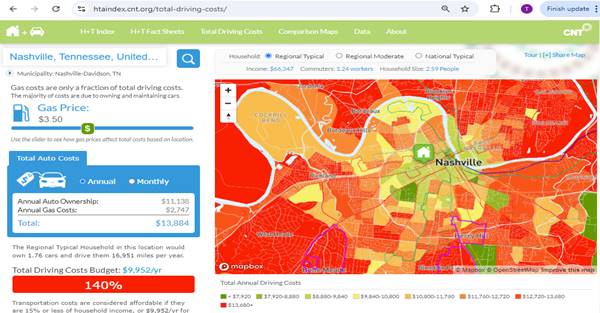
Households in central, multimodal neighborhoods tend to spend much less on transportation than in urban fringe areas, as illustrated in the following map. These transportation cost savings often offset higher housing costs, making central neighborhoods most affordable overall.
Housing and Transportation (H+T) Affordability Index
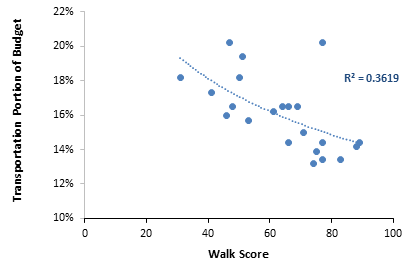
Transportation affordability increases with Walk Score ratings, as illustrated below. This indicates that more compact and multimodal neighborhoods significantly increase transportation affordability and provide many co-benefits. Multimodal transportation also helps reduce traffic congestion, crashes and pollution emissions, and by improving non-auto travel options improves public fitness and health, helps achieve social equity goals, and increases economic resilience (resident’s ability to respond to economic shocks such as reduced income, illness or a vehicle failure).
Transportation Spending Versus Walk Score
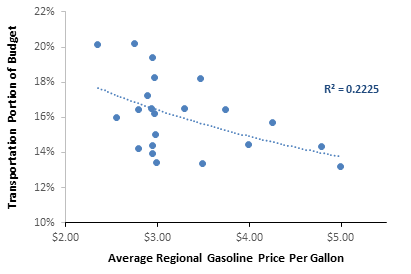
This analysis indicates that automobile ownership is unaffordable to most low-income and many moderate-income households. When families cannot afford food, housing, or healthcare the ultimate cause is often excessive travel costs, including sometimes large and unexpected expenses. Efforts to make driving cheaper tend to be counterproductive because they impose indirect costs and encourage automobile-dependency which reduces affordability, as indicated by the following graph which shows that lower fuel prices are associated with higher total transportation cost.
Transportation Spending Versus Fuel Price
Improving transportation affordability
There are many possible ways to increase transportation affordability, some of which are better than others overall. Some strategies simply shift costs to other sectors, reducing affordability overall. For example, low fuel taxes and road tolls increase general taxes (to pay roadway costs not funded by user fees). No-fault insurance reduces crash victim compensation. “Free” parking increases housing costs (for residential parking) and the price of goods (for customer parking). By making driving cheaper, vehicle underpricing increases traffic problems including congestion, crashes and pollution, and reduces travel options for non-drivers by reducing demand for non-auto modes.
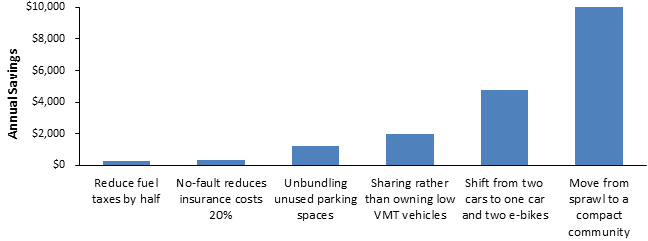
Most vehicle cost reduction strategies, such as low fuel taxes and no-fault insurance, provide modest savings; strategies that reduce vehicle ownership and parking costs provide much larger affordability benefits, as illustrated below.
Estimated Savings from Transportation Affordability Strategies
The most effective and equitable affordability strategies improve lower-cost modes, provide financial rewards for reduced driving and parking needs, and create more compact and multimodal communities where it is easy get around without driving. In addition to increasing affordability these strategies help achieve other community goals including more independence and opportunity for non-drivers, improved public fitness and health, plus reduced congestion, infrastructure costs, traffic risks and environmental harms. They are win-win solutions. However, strategies intended to make driving more affordable by reducing fuel taxes, road tolls and parking fees tend to contradict other goals, and over the long run tend to reduce affordability by increasing automobile dependency and sprawl.
There is evidence of significant latent demand for affordable mobility and accessibility options. Although few motorists want to give up driving altogether, surveys indicate that many would prefer to live in more compact and multimodal communities where they drive less, use affordable modes more, and spend less time and money on driving. Conventional planning does a poor job of responding to these demands. Below is a list of specific ways that planning can better responds to transportation affordability goals.
Guidance for affordable transportation planning
- Including indirect costs such as residential parking.
- Consider both housing and transportation costs.
- Consider vehicle ownership as well as operating costs.
- Give special consideration to affordability for people with disabilities, low incomes and other special needs.
- Identify latent demand for affordable travel options.
Multimodal affordable transportation strategies
Below is a list of multimodal affordable transportation strategies. These strategies tend to have synergistic effects; they become more effective and beneficial as more are integrated, for example, by improving non-auto modes, supporting carsharing, implementing TDM incentives that reward reductions in driving and parking, and, creating more compact communities so travelers have better travel options and incentives to use the most efficient possible. Together they can provide large savings and benefits, particularly for physically, economically and socially disadvantaged travelers.
- Apply a sustainable transportation hierarchy in planning and funding. Align individual planning decisions to support strategic goals.
- Improve and encourage affordable modes including walking, bicycling, e-bikes, public transit, car-sharing and telework.
- Spend at least the portion of transportation budgets on affordable modes as their potential mode shares. For example, spend up to 20% of transportation funding on walking and bicycling improvements if that would give them a 20% mode share, and more if justified to achieve strategic goals and make up for past underinvestments.
- Support vehicle sharing (carsharing and MaaS) and encourage households to minimize private vehicle ownership.
- Implement Smart Growth policies that create compact, multimodal neighborhoods where it is easy to use affordable modes.
- Increase affordable housing in multimodal neighborhoods.
- Apply complete streets policies to ensure that all streets accommodate affordable modes.
- Reform parking policies to increase efficiency. Unbundle and cash out free parking so non-drivers are no longer forced to subsidize parking facilities they do not need.
- Implement TDM incentives that encourage travelers to use affordable and resource-efficient modes when possible.
Conventional economics tends to assume that happiness requires more income. This analysis offers a different perspective; it investigates ways to reduce transportation costs and therefore the money required to satisfy people’s travel needs. This is an important and unique analysis. It should be of interest to policy makers, planners, advocates and anybody who wants more efficient and equitable transportation.
What do you think? Do transportation agencies need clearer goals and better tools for incorporating transportation system user demands for more affordability into planning?


Planning for True Transportation Affordability: Beyond Common Misconceptions
Transportation affordability is important but often misunderstood, resulting in misguided solutions. New research helps identify ways to provide true affordability for economic freedom, opportunity and happiness.

Alabama: Trump Terminates Settlements for Black Communities Harmed By Raw Sewage
Trump deemed the landmark civil rights agreement “illegal DEI and environmental justice policy.”

Planetizen Federal Action Tracker
A weekly monitor of how Trump’s orders and actions are impacting planners and planning in America.

The 120 Year Old Tiny Home Villages That Sheltered San Francisco’s Earthquake Refugees
More than a century ago, San Francisco mobilized to house thousands of residents displaced by the 1906 earthquake. Could their strategy offer a model for the present?

Housing Vouchers as a Key Piece of Houston’s Housing Strategy
The Houston Housing Authority supports 19,000 households through the housing voucher program.

Rural Population Grew Again in 2024
Americans continued to move to smaller towns and cities, resulting in a fourth straight year of growth in rural areas.

Safe Streets Grants: What to Know
This year’s round of Safe Streets for All grant criteria come with some changes.
Urban Design for Planners 1: Software Tools
This six-course series explores essential urban design concepts using open source software and equips planners with the tools they need to participate fully in the urban design process.
Planning for Universal Design
Learn the tools for implementing Universal Design in planning regulations.
Clanton & Associates, Inc.
Jessamine County Fiscal Court
Institute for Housing and Urban Development Studies (IHS)
City of Grandview
Harvard GSD Executive Education
Toledo-Lucas County Plan Commissions
Salt Lake City
NYU Wagner Graduate School of Public Service