


Accessibility-based planning minimizes the distance that people must travel to reach desired services and activities. Measured this way, increased density can provide more total benefits than increased speeds.

We are currently in a paradigm shift from mobility- to accessibility-based planning, changing how we define transportation problems and evaluate potential solutions. Mobility-based planning assumes that the goal is to maximize the speed and distance that people can travel. Accessibility-based planning recognizes that mobility is seldom an end in itself; the ultimate goal of most travel is to access services and activities. Many factors can affect this ability including mobility, transportation system connectivity, proximity, user information, affordability, and mobility substitutes that reduce the need for physical travel.
This inverts our planning goals. Rather than trying to maximize speed planners should strive to minimize the distances that people must travel to reach services and activities. The new paradigm recognizes the value of slower modes, improved network connectivity, and increased proximity. The table below compares the old and new paradigms.
| Old (Mobility-Based) | New (Accessibility-Based) |
| Mobility (vehicle traffic speeds) |
Vehicle traffic speeds Non-auto travel conditions Transport network connectivity Proximity (distances between destinations) User information Affordability Mobility substitutes (telecommunications and delivery services) |
The old paradigm assumed that the goal is to maximize mobility. The new paradigm recognizes that our ultimate goal is to maximize accessibility so an efficient transportation system minimizes the distances that people must travel to reach desired services and activities.
My recent column, A Better Understanding of Smart Growth Benefits, examined the various benefits of compact, multimodal communities. One of the largest benefits is increased accessibility, particularly for non-drivers. Smart Growth communities have less mobility — people drive less and rely more on slower modes, traffic speeds are lower, trips are shorter, and people travel fewer miles — but they have more total accessibility and less disparity between drivers and non-drivers. Smart Growth communities provide better access by non-auto modes than what is provided by automobile travel in automobile-dependent, sprawled areas, at a fraction of the financial cost. Let’s examine this bold claim.
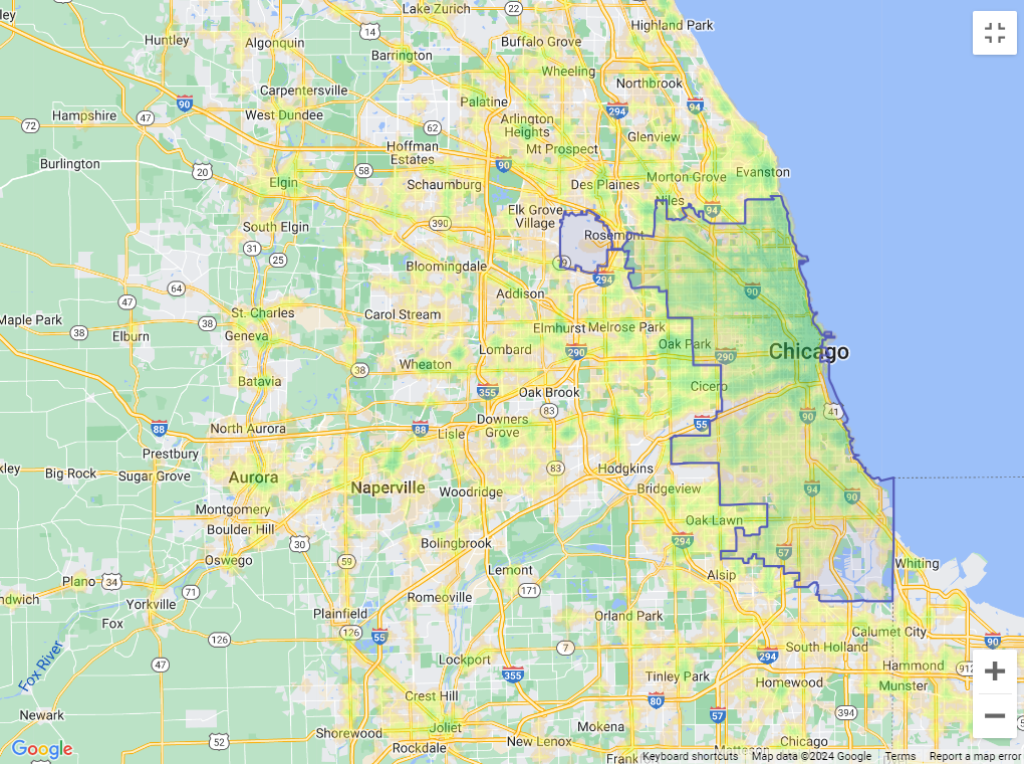
A good tool for evaluating accessibility is the Accessibility Explorer which heatmaps the number of services and activities that can be reached within a defined time period by various modes in the Chicago region. For example, it can report the number of jobs, grocery stores, schools, hospitals, libraries, parks, or fire stations that a person can reach within 20, 30, or 60 minutes by walking, bicycling, public transit, or driving, from any block group.
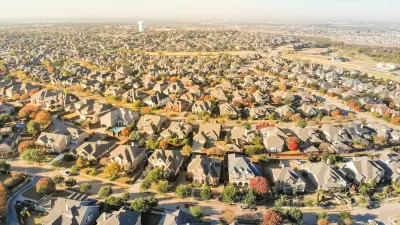
The map below shows that in many outlying Chicago suburbs motorists can access less than 15 percent of regional jobs, indicated by lighter greens, and they must bearnthe high costs of automobile commuting, typically more than $7,000 annually.
Automobile accessibility

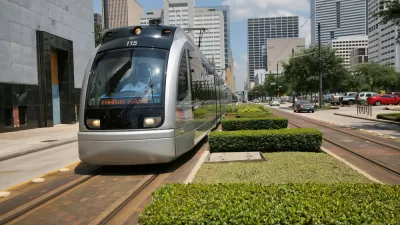
The map below shows that in central neighborhoods, transit users can access more than 15 percent of regional jobs, indicated by darker greens, and their commuting costs are moderate, typically $500 to $1,000 annually. Although this represents a small portion of the region's area it includes a much larger portion of its population, and this could increase with Smart Growth policies that allow more infill development along transit lines.
Transit accessibility

The map below shows that in central neighborhoods, bicyclists can access more than 15 percent of regional jobs, with minimal costs, typically $200 to $400 annually for bike repairs and tasty snacks.
Bicycling accessibility

Another indicator of job access is commute duration, the number of minutes workers must spend traveling to jobs. The Commute Duration Dashboard heatmaps this information, as illustrated below. It shows that central neighborhood workers spend much less time commuting than in outlying areas, despite higher non-auto mode shares (they rely more on slower modes such as walking and public transit) and more intense local traffic congestion.
Chicago-area commute durations

Commuters can save thousands of dollars and hundreds of hours annually by living in a central neighborhood, and those areas also tend to have better-paying jobs. As a result, workers tend to be much better off economically living in accessible, multimodal neighborhoods. This is particularly true of lower-wage workers who would spend an excessive portion of their income on commuting by car.
Of course, worksites are only one of many activities that people must access. In fact, commuting represents less than 20 percent of total trips and this is declining due to more telecommuting and working at home. The Walk Score is a good indicator of access to commonly-used services such as shops, restaurants, and bars. A Walk Score over 70, shown in dark green in the following heatmap, indicates that numerous services are located within walking and bicycling distances, so it is easy to minimize driving and associated costs. Many urban neighborhoods and some small towns have this level of accessibility.
Chicago region walk sore heat map
Most older neighborhoods built before 1950 are compact, mixed, have a dense network of streets with sidewalks, lower traffic speeds, and local schools and parks. In these ways they prioritized proximity and slower modes over mobility and faster vehicle traffic, resulting in high levels of overall accessibility and minimizing disparities between drivers and non-drivers, making them more efficient and equitable.
I can report from personal experience — our family hasn't owned a car in fifteen years — that living in an older neighborhood and working at home makes it easy to live car-free. As a result, we save lots of money and travel time, experience less stress, exercise more, and are more connected to our neighborhood.
This shows that proximity is much more important than mobility in providing accessibility: location, location, location. For the last century, transportation planning practices contradicted this. Transportation agencies built urban highways that destroyed and degraded accessible and multimodal neighborhoods to benefit suburban motorists. This was racist and classist, but the mechanism was the high value that planners placed on increasing vehicle traffic speeds, measured as travel time savings, while ignoring the loss of accessibility imposed on urban neighborhood residents.
Of course, many other factors affect people's transportation and neighborhood preferences. Some people need their cars for work or after-work activities, and not everybody can bicycle or use transit even if it is available. However, surveys such as the National Association of Realtor's National Community Preference Survey indicate that many people would prefer living in more compact, walkable neighborhoods than they currently do but cannot due to a lack of supply.
This has important implications for transportation agencies. It indicates that not only should they do much more multimodal planning to support slower but more affordable and efficient modes, improve roadway connectivity, and support mobility substitutes such as telecommunications, but they also have a legitimate role in supporting Smart Growth policies that create more compact and mixed neighborhoods. Let's consider what this means.
Considering land, construction, and operating expenses, the most cost-effective type of housing is usually mid-rise (three to six stories) multifamily. This type of building requires at least a quarter-acre, and preferably much more, to maximize efficiency and minimize impacts on neighbors. Such large parcels are scarce and therefore expensive in accessible urban neighborhoods.
One community in my region has a solution to this problem. Two decades ago the suburb of Langford decided to create a compact downtown as part of its sprawl repair program. To make this happen the city purchases land, offering owners a fair price but using eminent domain if needed, to assemble sufficiently large parcels in key locations, which are auctioned to developers to create the buildings the city needs. Critics might protest that it is unfair for governments to expropriate property to increase its value to developers, but that may be necessary to improve accessibility. The alternative, allowing more automobile-dependent sprawl, requires governments to expropriate land to build wider roads to accommodate more traffic. Why should land assembly be acceptable for roadway expansions but not for accessible infill development? Because Smart Growth provides numerous economic, social, and environmental benefits, virtually everybody is better off if we apply accessibility- rather than mobility-based planning.
To create complete, affordable, livable, healthy, and sustainable communities we need to change departments of transportation that focus on moving vehicles into departments of accessibility that create compact, multimodal neighborhoods where the need for motor vehicle travel can be minimized.
For more information
Accessibility Observatory is a resource for the research and application of accessibility-based transportation system evaluation.
Moving to Access Initiative, Brookings Institution.
Commute Duration Dashboard by the Mineta Transportation Institute produces heatmaps showing commute duration and related information for most U.S. communities.
COST Accessibility Instruments is a European program to develop practical tools for accessibility planning.
Susan Handy (2020), “Is Accessibility an Idea Whose Time has Finally Come?," Transportation Research Part D: Transport and Environment, Vo. 83.
ITF (2020), Accessibility and Transport Appraisal, International Transport Forum.
Jonathan Levine, et al. (2012), “Does Accessibility Require Density or Speed?” Journal of the American Planning Association, Vol. 78/2, pp. 157-172 (doi.org/10.1080/01944363.2012.677119).
David Levinson, Accessibility, The Transportist.
David Levinson and David King (2020), Transport Access Manual: A Guide for Measuring Connection between People and Places, University of Sydney.
Todd Litman (2013), “The New Transportation Planning Paradigm,” ITE Journal, Vol. 83, June, pp. 20-28.
Todd Litman (2023), Selling Smart Growth, Victoria Transport Policy Institute.
Todd Litman (2024), Understanding Smart Growth Savings, Victoria Transport Policy Institute.
SSTI (2021), Measuring Accessibility: A Guide for Transportation and Land Use Practitioners, State Smart Transportation Initiative.
Travel Time Maps show the locations that can be reached within a given time period by walking, bicycling, public transport and driving.

Moving from Moving Cars to Moving People
After a three quarters of a century of building to accommodate cars and not people, it's going to take big changes to get the transit system the United States needs, argues a Next City editorial.
Zoning for Good
A new book highlights the power of zoning to change communities for the better.

New Orleans Makes Push for Accessibility Improvements Ahead of Super Bowl
Major sporting events like the Olympics and the Super Bowl can serve as catalysts for major changes in transportation infrastructure and accessibility.

Alabama: Trump Terminates Settlements for Black Communities Harmed By Raw Sewage
Trump deemed the landmark civil rights agreement “illegal DEI and environmental justice policy.”

Planetizen Federal Action Tracker
A weekly monitor of how Trump’s orders and actions are impacting planners and planning in America.

The 120 Year Old Tiny Home Villages That Sheltered San Francisco’s Earthquake Refugees
More than a century ago, San Francisco mobilized to house thousands of residents displaced by the 1906 earthquake. Could their strategy offer a model for the present?

Ken Jennings Launches Transit Web Series
The Jeopardy champ wants you to ride public transit.

BLM To Rescind Public Lands Rule
The change will downgrade conservation, once again putting federal land at risk for mining and other extractive uses.

Indy Neighborhood Group Builds Temporary Multi-Use Path
Community members, aided in part by funding from the city, repurposed a vehicle lane to create a protected bike and pedestrian path for the summer season.
Urban Design for Planners 1: Software Tools
This six-course series explores essential urban design concepts using open source software and equips planners with the tools they need to participate fully in the urban design process.
Planning for Universal Design
Learn the tools for implementing Universal Design in planning regulations.
Clanton & Associates, Inc.
Jessamine County Fiscal Court
Institute for Housing and Urban Development Studies (IHS)
City of Grandview
Harvard GSD Executive Education
Toledo-Lucas County Plan Commissions
Salt Lake City
NYU Wagner Graduate School of Public Service