


During the last 120 years, our mobility increased by an order of magnitude, but so did associated costs. Are we better off? Could we do better?

My newest report, Our World Accelerated, uses various data sources to examine how 120 years of transportation progress affects our lives and communities. It’s a fun and interesting project. As far as I can tell, this is the first time that this information has been assembled and presented in this way.
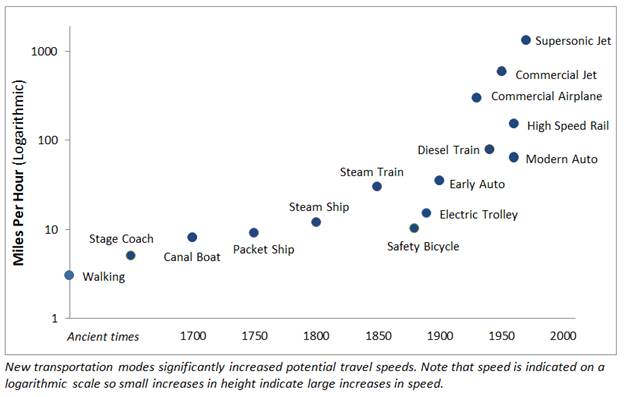
Transportation innovations have transformed society in the past and will surely do so in the future. In ancient times, travel was mostly by foot, so most people seldom ventured beyond their villages and imported goods were costly and rare. Over centuries, new technologies and services—wagons, boats, ships, railroads, automobiles and aircraft—expanded where we could go and the products we could use, improving our lives in many ways. The figure below indicates when new modes became widely available and their typical operating speeds.
New Modes’ Initial Availability and Typical Operating Speeds
These increases in vehicle travel speed and distance had many economic, social and environmental impacts on our lives and communities, some desirable but others not so. Let’s see how transportation innovations during the last 120 years affected our lives and communities. An honest accounting of these impacts is useful to help understand some of our current problems and guide future transportation planning.
Before 1900, automobile and air travel hardly existed; by 2000 they were dominant forms of travel. Mobility became much faster and cheaper. We can now travel about ten times faster and farther than in 1900. Although this provided benefits, it also imposed significant economic, social and environmental costs, including large increases in household expenses, infrastructure costs, and health problems, plus reduced non-auto transport options. These costs offset a major portion of benefits, and tend to be inequitable; they harm people who cannot drive or have low incomes.
The figure below shows how per-capita mobility changed during the last 120 years. In the pre-automobile period, walking and bicycling were the dominant travel modes, and most people travelled three or four miles a day, with an occasional train or boat trip. Rail and public transit passenger-miles peaked early during the first half of the 20th century. Motor vehicle travel increased steadily, from virtually zero in 1900 to approximately 10,000 annual miles per capita in 2000. Soon afterwards, it peaked.
Travel Trends: Estimated Annual Passenger-Miles by Mode
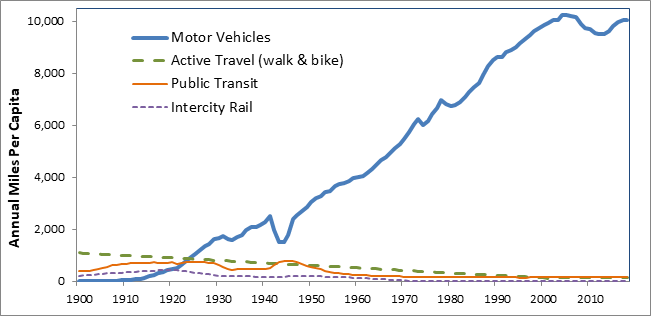
Before 1900 people relied primarily on walking, with occasional bicycle and rail trips. Motor vehicle travel grew steadily during the 20th century. About 10% of motor vehicle travel is for freight.
This indicates that during the 20th century, transportation innovations increased average mobility approximately ten fold. However, it also increased many economic, social and environmental costs.
When walking was the primary travel mode, the primary user expense was shoe leather. Horse, carriage, boat and train travel were expensive, so most people seldom used them for personal travel. In the late 19th century, safety bicycles became more affordable. Many cities developed trolley networks which typically cost 5₵ per trip when most workers earned one to three dollars per day, so a round-trip trolley commute represented just 3-10% of most workers’ income. A 1901 survey of workingmen’s families’ expenditures had no category for transportation (see below), indicating that mobility costs were insignificant for most moderate-income families.
Workingman’s Household Expenditures in 1901
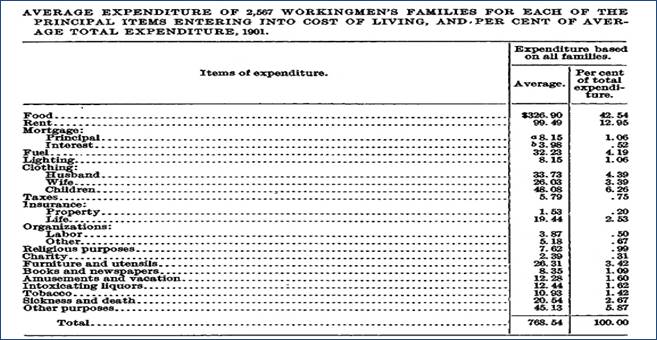
This 1901 household expenditure survey had no category for transportation, indicating that prior to the automobile age, transportation expenses were insignificant for most families.
Current household expenditure surveys indicate that typical households now spend 16-18% of their budgets on transportation. Vehicle travel also imposes indirect expenses such as residential parking and local taxes spent on roadways, which typically add 10-20% to housing costs. The figure below illustrates estimated household transport costs trends.
Household Transportation Expenditures
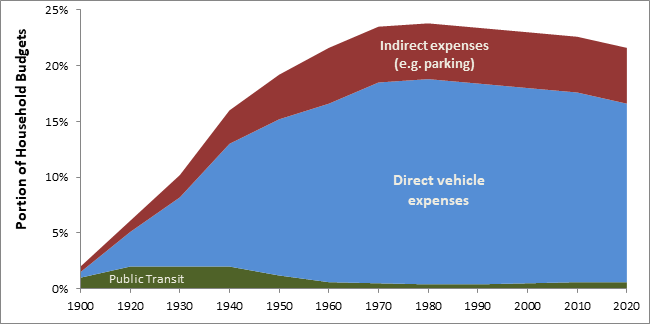
Household transportation expenses increased significantly as motor vehicle travel grew.
What explains this huge growth in transportation spending? The figure below compares the user costs of various modes. Walking and bicycling are the most affordable. Public transit and automobile travel have moderate costs per passenger-mile, but automobile travel has the highest annual costs due to high annual vehicle-miles; it stimulates more travel which increases total costs. Automobile travel provides benefits that may justify some additional transportation spending, but public policies that favored automobile travel over cheaper modes, and sprawl over compact development, result in more automobile travel than what households demand or is economically optimal.
Typical User Cost Per Mile and Year
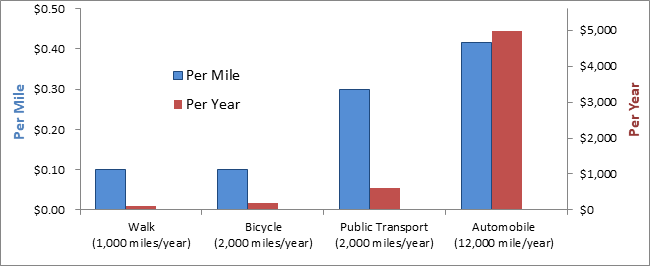
Automobile travel tends to be the most expensive travel mode.
People who live in vehicle-owing households travel about five times as many annual miles and spend about five times as much money on transport as people who are car-free. Because of these high costs, automobile travel has relatively low effective speeds, which measures travel distance divided by time spent travelling plus time spent earning money to pay travel expenses. Effective speeds vary depending on wage rates, vehicle expenses, distance travelled, and mode. The figure below shows the number of minutes spent travelling and earning money for travel expenses for various types of travel.
Minutes Per Mile for Various Travellers

This shows that measured by effective speed, automobile travel is highly regressive. Because they must work much more time to afford their vehicles, lower-income worker’s travel speed is much lower than for higher-income workers. Most lower-wage motorists spend more time earning money to pay vehicle expenses than they do driving. A motorist who earns $10 per hour and spends $5,000 per year on their vehicle must devote about 2.5 hours each workday earning money to pay vehicle expenses, so their effective speed is generally lower than bicycling or public transit. For most lower-wage workers (under about $20 per hour take-home pay), driving is, overall, slow and unaffordable.
Of course, every traveller has unique needs and abilities. Higher income people can afford the higher costs of automobile travel and some lower-wage workers enjoy driving and have few other financial obligations, and so can bear the high costs of automobile travel. However, many low- and moderate-income households spend more on their vehicles than is affordable. When people say that they cannot afford healthy food, healthcare or education, or are unable to reduce work hours in order to spend more time with their family or other valued activities, the root problem is often excessive motor vehicle expenses. As a result, many people would be better off overall if they could choose slower but cheaper travel options.
Automobile travel is “co-produced” by motorists, who supply vehicles, governments that supply roadways, and property owners who supply parking facilities. When somebody purchases a vehicle they expect governments and businesses to provide roads and parking facilities for their use. As motor vehicle travel increases in a community, so do road and parking facility costs. Public spending on transportation increased from about 0.7% to 2% of Gross Domestic Product during the 20th century, as vehicle travel increased, as illustrated below.
Government Transportation Spending Relative to GDP
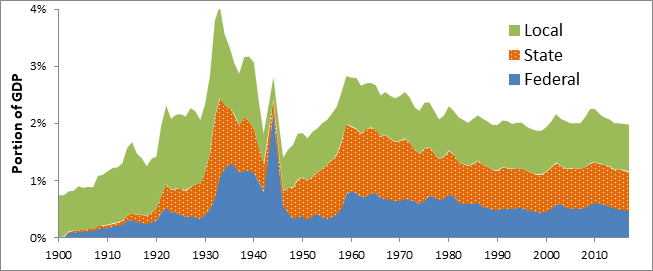
During the 20th century, public spending on transportation infrastructure increased from 0.7% to more than 2% of Gross Domestic Product (GDP), due largely to the increased roadway spending.
Many people assume that user fees, such as fuel taxes, vehicle registration fees and road tolls, cover all roadway costs, but in fact, they only cover about half of U.S. road expenditures. The remainder is financed by general taxes that residents pay regardless of how they travel finance, representing a subsidy from people who drive less than average to those who drive more than average. For example, in 2016, U.S. governments spent $219 billion on roadways, of which $111 billion was funded by user fees, and there were 274 million registered vehicles, which averages $800 per vehicle of which $395 can be considered a subsidy.
Automobile travel also requires parking at each destination. Most zoning codes mandate that property owners provide parking, typically 1-2 spaces per housing unit and 2-8 spaces per 1,000 square feet of commercial space. Several recent surveys have measured the total effects of these policies. A study by Geography Professor Amélie Y. Davis used detailed aerial photographs to count off-street parking spaces in Illinois, Indiana, Michigan, and Wisconsin. They found approximately three non-residential off-street spaces per vehicle but this is an underestimate because it did not count spaces hidden in parking structures or tree canopies. Other major studies also indicate that typical North American communities have three to eight government-mandated off-street parking spaces per motor vehicle, with lower rates in urban areas where parking facilities can be shared, and higher rates in suburban and rural areas where each destination must supply all of its own parking.
These facilities are expensive. Constructing a space typically costs $2,000-10,000 for surface lots and $20,000-60,000 in structures. Considering land, construction, and operating expenses, the total annualized costs of a parking space ranges from approximately $500 for surface parking on inexpensive land up to $3,000 for structured parking in a prime location. Assuming three to six spaces per vehicle, this averages $2,000-6,000 total annual parking costs per vehicle. Many parking spaces are worth more than the vehicles that occupy them, and most vehicles are worth less than the total value of the numerous spaces provided for their use.
The graph below illustrates how per capita vehicle road and parking costs increased since 1900. This indicates that for every dollar motorists spend purchasing a vehicle, somebody must spend more than a dollar for its infrastructure, a sort of matching grant for automobile travel.
Estimated Road and Parking Facility Costs
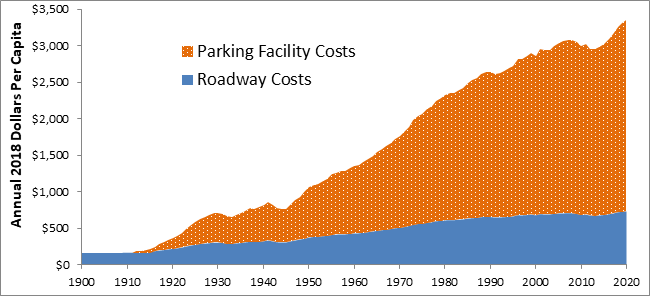
As automobile travel increased during the last 120 years, so did road and parking infrastructure costs.
The figure below summarizes these impacts. It shows the growth in real (inflation-adjusted) per capita vehicle and infrastructure costs. They increased substantially as per capita vehicle travel grew.
Estimated Per Capita Vehicle and Infrastructure Costs
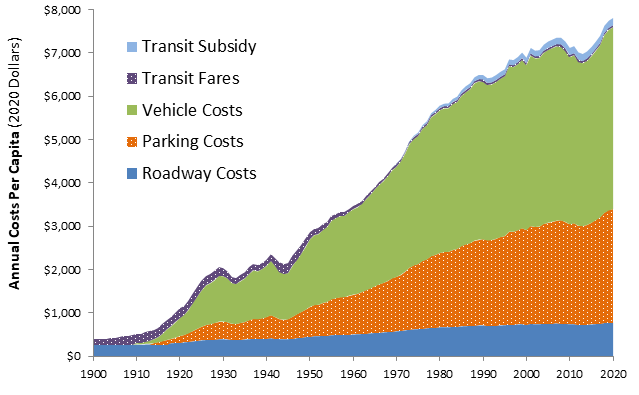
As automobile travel grew during the last 120 years, per capita vehicle, road and parking facility costs increased significantly.
Conclusions
Let’s summarize some key findings from this study.
During the last 120 years, motor vehicles became increasingly reliable, comfortable and affordable, and integrated into our lives and communities. Before 1900, automobiles and aviation hardly existed; by 2000 they were dominant travel modes. Travel became much faster and cheaper. We now travel about ten times faster and farther than in 1900. This huge increase in mobility transformed our lives and communities in countless ways. At the start of the 20th century, most people lived, worked, shopped and played in their neighborhood; by the end of the century it was normal to drive hundreds of miles per week to destinations scattered throughout a region, and to fly thousands of miles for holidays.
Second, this growth is unlikely to continue. In North America, traffic speeds peaked about 1970 and subsequently declined due to congestion, and growing safety and environmental concerns. Similarly, air travel became somewhat slower after 2000 due to new security and environmental requirements. Per capita automobile travel is likely to decline as it is displaced by new technologies that reduce the need for physical travel, and due to the effects of vehicle travel reduction policies. Travel could be faster if we were willing to bear higher financial, safety and environmental costs, but there is inadequate public support; few citizens request, “Please raise my taxes to finance more highway expansions and supersonic jets.”
Third, although increased mobility provided benefits, it also imposed large economic, social and environmental costs, and was particularly harmful to physically and economically disadvantaged people. In 1900, a typical working-class family had negligible transportation expenses, a century later most moderate-income households devoted about 20% of their budgets to transport. An average automobile commuter spends about 2.5 hours each workday driving or working to pay vehicle expenses. Increased vehicle travel also increased infrastructure costs, accidents, health problems, environmental damage and community degradation. Before 1950, non-auto modes provided relatively convenient and affordable accessibility, but automobile-oriented planning subsequently reduced their efficiency. People who for any reason cannot, should not, or prefer not to drive, plus many motorists, were harmed by policies that favor automobile travel over other modes, and sprawl over more compact development. Current high levels of automobile travel, and the costs they impose, reduce economic productivity.
Fourth, high levels of mobility do not necessarily reflect consumer preferences. For most of the last century, public policies favored automobile travel and dispersed development over other modes and compact development, creating automobile-dependent communities. Although few people want to give up driving altogether, surveys indicate that many would prefer to drive less, rely more on non-auto modes, and live in more compact, walkable neighborhoods, provided these options are convenient, comfortable and affordable.
After a century of progress we are ten times more mobile, but are we ten times wealthier, healthier or happier? Did faster travel gain us more free time, better social connections or more contentment? On the contrary, our modern transportation system in many ways forces people to travel more, spend more, work harder, and have less freedom than many want.
A ten-fold increase in mobility is an impressive accomplishment. The people who helped this happen should be proud. However, if your income increased ten-fold but you found yourself no wealthier, happier or freer, you should wonder, “How was my wealth squandered?” We can ask the same question from transport progress: “How did we squander the potential benefits of improved mobility?”
Note, Our World Accelerated is currently a draft report. Please let me know if you have suggestions for improving this analysis.

How Transportation Costs Vary Across US Cities
A new analysis reveals how annual transportation costs compare around the country.
Philadelphia Councilmember Proposes Transit Access Fund
The plan would allocate 0.5 percent of the general fund toward mobility subsidies for low-income households.
Baltimore Ordered to Improve Sidewalk Accessibility
The city is one of many to face lawsuits for failing to comply with the Americans with Disabilities Act.

Trump Administration Could Effectively End Housing Voucher Program
Federal officials are eyeing major cuts to the Section 8 program that helps millions of low-income households pay rent.

Planetizen Federal Action Tracker
A weekly monitor of how Trump’s orders and actions are impacting planners and planning in America.

Ken Jennings Launches Transit Web Series
The Jeopardy champ wants you to ride public transit.

Crime Continues to Drop on Philly, San Francisco Transit Systems
SEPTA and BART both saw significant declines in violent crime in the first quarter of 2025.

How South LA Green Spaces Power Community Health and Hope
Green spaces like South L.A. Wetlands Park are helping South Los Angeles residents promote healthy lifestyles, build community, and advocate for improvements that reflect local needs in historically underserved neighborhoods.

Sacramento Plans ‘Quick-Build’ Road Safety Projects
The city wants to accelerate small-scale safety improvements that use low-cost equipment to make an impact at dangerous intersections.
Urban Design for Planners 1: Software Tools
This six-course series explores essential urban design concepts using open source software and equips planners with the tools they need to participate fully in the urban design process.
Planning for Universal Design
Learn the tools for implementing Universal Design in planning regulations.
Heyer Gruel & Associates PA
Ada County Highway District
Institute for Housing and Urban Development Studies (IHS)
City of Grandview
Harvard GSD Executive Education
Toledo-Lucas County Plan Commissions
Salt Lake City
NYU Wagner Graduate School of Public Service