


One common argument against road diets and other pro-walkability policies is that seniors need cars more than anyone else. Is this claim borne out by data?

In arguments about street design and transportation, senior citizens are often a political football. Urbanists old and new argue that as our population ages, more people will be unable to drive, and thus will need better sidewalks and more public transit. On the other hand, defenders of the status quo argue that seniors walk more slowly than everyone else, and thus are more likely to need cars and taxicabs. This dispute made me wonder: are seniors more likely or less likely to have cars than everyone else?
I started with American Community Survey data about my current home in Manhattan– ground zero for this sort of argument, since (unlike in the rest of the U.S.) most of that borough's working-age adults do not own cars. In Manhattan, there are about 129,000 senior-headed households with no car, and 36,000 with a car. So 78 percent of seniors are car-free- less than the car-free percentage of under-35 households (88 percent) but more than the comparable number for households headed by people aged 35-64 (72 percent). So here the results seem a little ambiguous: seniors are more likely to drive than millennials, but less likely than adults in the prime of life.
Of course, Manhattan is an aberration. What about places with both significant public transit and significant car ownership? I chose a couple of New York’s outer boroughs and a couple of nearby cities as examples.
In Brooklyn, about 66 percent of under-35 households, 63 percent of over-65 households, and 49 percent of 35-64 households are car-free. And in Queens, about 47 percent of under-35 households, 43 percent of over-65 households, and 33 percent of 35-64 households are car-free. So in the outer boroughs, seniors are also somewhere in between millennials and middle-aged adults- but with one significant difference. In Manhattan, senior levels of car ownership are almost exactly halfway between those of millennials and those of middle-aged adults. By contrast, in the outer boroughs seniors are only slightly more likely than millennials to own cars.
What about other cities? In Pittsburgh, only 20 percent of 35-64 households, 22 percent of under-35 households, and 31 percent of over-65 households are car-free. Similarly, in Philadelphia 27 percent of 35-64 households, 32 percent of millennial households, and 37 percent of over-65 households are car-free. In these cities, seniors are actually the least likely to own cars. This pattern applies to more automobile-dependent cities as well: in Houston and Dallas, only 8 percent of under-35 households lack a car. By contrast, just over 14 percent of over-65 Houston households, and just over 15 percent of senior-headed Dallas households, lack cars.
The national pattern is similar: in the United States generally, 12 percent of over-65 households have no car, while 9 percent of under-35 households have no car. And as in every city I looked at, households headed by persons aged 35-64 are most likely to have a car: only 7 percent of households in this age group have no car.
In sum, the relationship between age and car ownership follows two different patterns: in New York City, millennials are the least likely to own cars and middle-aged households are the most likely, with seniors somewhere in between. Everywhere else, seniors are less likely to own cars than millennials or the middle-aged. I found no city where seniors are the most car-owning age group- a fact that seems to me to discredit the "seniors need cars" narrative.

An Unexpected Turn for California's New State Population Report
Population data released May 1 by the Department of Finance reveals the Golden State's lowest population growth rate on record, at 0.47 percent.
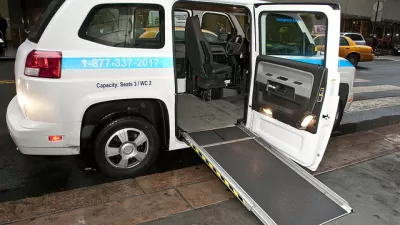
'Mobility for All' Responds to Growing Need for Quality Paratransit Service
Accessible technology and a centralized database and call center will help deliver a one-call, one-click transportation information system for seniors and people with special needs in the Portland region.

Paris Bike Boom Leads to Steep Drop in Air Pollution
The French city’s air quality has improved dramatically in the past 20 years, coinciding with a growth in cycling.

Study: Maui’s Plan to Convert Vacation Rentals to Long-Term Housing Could Cause Nearly $1 Billion Economic Loss
The plan would reduce visitor accommodation by 25,% resulting in 1,900 jobs lost.

Alabama: Trump Terminates Settlements for Black Communities Harmed By Raw Sewage
Trump deemed the landmark civil rights agreement “illegal DEI and environmental justice policy.”

Why Should We Subsidize Public Transportation?
Many public transit agencies face financial stress due to rising costs, declining fare revenue, and declining subsidies. Transit advocates must provide a strong business case for increasing public transit funding.

Paris Bike Boom Leads to Steep Drop in Air Pollution
The French city’s air quality has improved dramatically in the past 20 years, coinciding with a growth in cycling.

Why Housing Costs More to Build in California Than in Texas
Hard costs like labor and materials combined with ‘soft’ costs such as permitting make building in the San Francisco Bay Area almost three times as costly as in Texas cities.

San Diego County Sees a Rise in Urban Coyotes
San Diego County experiences a rise in urban coyotes, as sightings become prevalent throughout its urban neighbourhoods and surrounding areas.
Urban Design for Planners 1: Software Tools
This six-course series explores essential urban design concepts using open source software and equips planners with the tools they need to participate fully in the urban design process.
Planning for Universal Design
Learn the tools for implementing Universal Design in planning regulations.
Smith Gee Studio
Alamo Area Metropolitan Planning Organization
City of Santa Clarita
Institute for Housing and Urban Development Studies (IHS)
City of Grandview
Harvard GSD Executive Education
Toledo-Lucas County Plan Commissions
Salt Lake City
NYU Wagner Graduate School of Public Service