


Participatory mapping has become an increasingly popular planning tool. The examples that follow highlight how communities are using participatory mapping.


Participatory mapping has become an increasingly popular planning tool. Maps have become every more prevalent in the daily lives of our residents, who use mobile mapping technology to guide them to a local restaurant, provide the fastest commute time, and explore new recreational opportunities. As a result, residents are increasing spatial literacy and interest in map making.
Participatory mapping is about getting people to share their knowledge of the community, identifying challenges or opportunities that directly impact their community. Participatory mapping allows community members to become active in the process of creating maps.
Planners, academics, and others are using participatory mapping tools such as Open Street Map, an open source tool, making it possible to edit a base map. There are also tool kits such as the City Resilience Action Planning Toolkit, which includes training on how to engage in participatory risk mapping. Highlighted below are examples of participatory mapping projects.
The Anti-Eviction Maps project focuses on documenting eviction of San Francisco Bay Area residents. The project includes oral histories and digital maps that visualize the increase in evictions. Residents are invited to complete an eviction survey, and the information is used to shape an understanding of the region's housing issues. In this project, 28 maps were developed using Open Street Map. 
The Detroit Food Map gathers food pricing to identify food deserts. Volunteers become part of the survey team and aid in the Nutritional Environment Measures Survey. The Motor City Mapping project brought together 150 Detroiters to survey every parcel in the city of Detroit, capturing photographs and information about the condition of every property. Mayor Duggan created GO DATA (Government Open Data Access To All) as a portal to provide 90 data sets to the public. This has made it easier to undertake participatory mapping.
Where in Wally? Playing off the children's character Where’s Waldo (known as Wally in the United Kingdom), a team of architects in preparation for the 2015 E17 Art Trail and London Festival of Architecture undertook a a project to understand treasured places and spaces. Members of the community tagged their favorite places adding descriptions, for example: "Discovered this old building in an unloved part of town - it looks like it might be developed for flats or other boring uses, but a public programme could transform the space around it." The result is a map of treasured places and spaces in Walthenstow, United Kingdom.
The Mappiness project called on residents in the United Kingdom to use an app to tag their mood, allowing community happiness to be mapped. This project, created by faculty at the London School of Economics and Political Science, worksto understand how people's feelings are affected by their environment—everything from air pollution to noise. Participants download an app on their iPhone providing some information about themselves and their health. Users receive a notification between once and up to five times a day asking users to report how they are feeling taking about 30 seconds. Users can take a photo of where they are if they like.
Is your community using participatory mapping? If so, share in the comments below how your community is benefiting from engaging the public in participatory mapping.

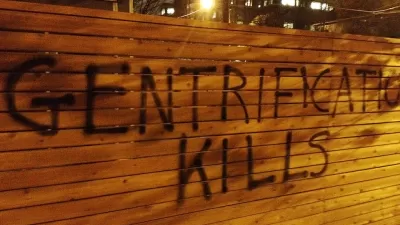
Grassroots Activists Take On Evictions, Displacement
On the ground, combating gentrification means putting a stop to cost-driven displacement and evictions. Grassroots organizations in some of the hardest-hit cities have dedicated themselves to that task.
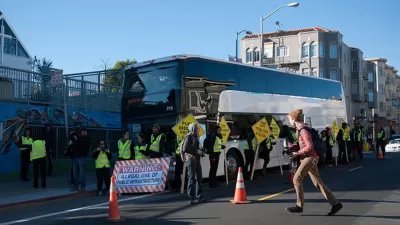
The Downside of Removing Tech Buses from Neighborhoods
A new study has shown that moving tech shuttle stops from neighborhoods to conform to a new "hub plan" would result in a drop in bus ridership, with most former riders resorting to driving their own vehicles to their Silicon Valley workplaces.
Tech Shuttle Pilot Might Stick Around San Francisco
They're hated by many, blamed for the city's gentrification, but are an integral part of regional transportation, enabling tech employees to work on the Peninsula and South Bay while living in the city. A city-approved pilot may become permanent.

Alabama: Trump Terminates Settlements for Black Communities Harmed By Raw Sewage
Trump deemed the landmark civil rights agreement “illegal DEI and environmental justice policy.”

Study: Maui’s Plan to Convert Vacation Rentals to Long-Term Housing Could Cause Nearly $1 Billion Economic Loss
The plan would reduce visitor accommodation by 25% resulting in 1,900 jobs lost.

Why Should We Subsidize Public Transportation?
Many public transit agencies face financial stress due to rising costs, declining fare revenue, and declining subsidies. Transit advocates must provide a strong business case for increasing public transit funding.

Paris Bike Boom Leads to Steep Drop in Air Pollution
The French city’s air quality has improved dramatically in the past 20 years, coinciding with a growth in cycling.

Why Housing Costs More to Build in California Than in Texas
Hard costs like labor and materials combined with ‘soft’ costs such as permitting make building in the San Francisco Bay Area almost three times as costly as in Texas cities.

San Diego County Sees a Rise in Urban Coyotes
San Diego County experiences a rise in urban coyotes, as sightings become prevalent throughout its urban neighbourhoods and surrounding areas.
Urban Design for Planners 1: Software Tools
This six-course series explores essential urban design concepts using open source software and equips planners with the tools they need to participate fully in the urban design process.
Planning for Universal Design
Learn the tools for implementing Universal Design in planning regulations.
Smith Gee Studio
Alamo Area Metropolitan Planning Organization
City of Santa Clarita
Institute for Housing and Urban Development Studies (IHS)
City of Grandview
Harvard GSD Executive Education
Toledo-Lucas County Plan Commissions
Salt Lake City
NYU Wagner Graduate School of Public Service