


When it comes to the Census, the term "alternative transportation" makes perfect sense. Eric Jaffe looks at the 15 metropolitan areas with the lowest auto commuting and describes the most popular alternatives.
While carpooling has been in decline since 1980 in the United States, it is still the second-most popular form of commuting, with 9.4 percent mode share after "drive-alone" at 76.4 percent. However, the Census lumps it with solo commuting, calling it "commute by auto" in the August survey (PDF) entitled, "Commuting by Automobile in the United States: 2013 [Figure 1, page 1 or click here for CityLab reproduction]." So if you are a carpooler, please understand the absence of that popular but declining mode in the foregoing accounting of the most popular alternatives.
Table 2 on Page 6 of the American Commuter Survey is entitled, "Metro Areas Among Those With the Lowest Rates of Automobile Commuting and Their Second Most Common Commute Mode: 2013." [Click here for the CityLab table.] It shows the 15 metros with the lowest rates for any Metropolitan or Micropolitan Statistical Areas (MSAs), from 57 percent for NY-Newark-Jersey City to 79 percent for State College, Pa. [Note that it differs from table 1 which lists "Metro Areas of Populations 500,000 or Greater Among Those With the Largest Declines."]
"The table lends itself to three broad categories," writes Jaffe, CityLab’s New York bureau chief: "Major metros, college towns, and second-ring cities." The following will discuss the second most popular mode in the 15 MSAs, regardless of category, after "commute by auto."
The most popular alternative, surprise, was walking—for four college towns, with Ithaca scoring an incredible 17.5% and the second highest scoring alternative overall. Biking wasn't popular, applicable only to Corvallis, Ore. with 8.8 percent mode share.
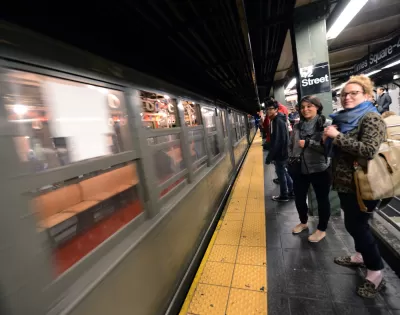
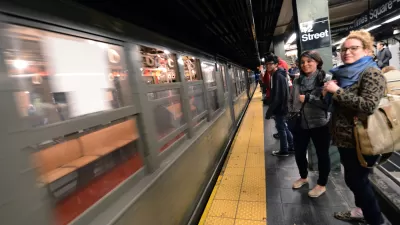
Tied for second was "subway or elevated rail" and "bus or trolley bus"—three areas for each mode, all in major metros. New York-Newark-Jersey City, NY-NJ-PA had the highest for any alternative mode: 18.9 percent for subway-elevated rail. For bus, "urban Honolulu" had the highest: 7.9 percent.
Two "second-ringers" were the only ones where commuter rail and ferries were favored: Bridgeport-Stamford-Norwalk, Conn. and Bremerton-Silverdale, Wash, respectively.
Boulder, Colo., which is both a college town and a second-ringer, was the only region where "work-at-home" was the favored alternative.
"So that’s how people get to work in the U.S. cities with the lowest car commute shares," concludes Jaffe.
There’s obviously loads of room for improvement: even on this list, it’s still the norm for seven or eight in 10 people to drive to work (New York City aside). That’s not likely to change in a big way until U.S. cities raise the cost of driving to work, but in the meantime there are some lessons to learn on the margins.
FULL STORY: How Americans Get to Work in Cities With the Lowest Car Commute Rates

Why Are Transit Systems Losing Riders?
Transit in general, and buses in particular, are losing riders, especially during off peak hours. Car pooling is down sharply as well.
Travel Trends: Are They Changing?
Recently released travel data show Americans returning to their cars as the economic recovery deepens. Alternative forms of transportation are not attracting new users.
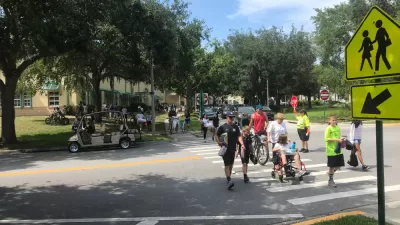
Earn Rewards for Traveling for by Foot, Bike, Bus, or Train
The city of Orlando is partnering with the Miles app.

Alabama: Trump Terminates Settlements for Black Communities Harmed By Raw Sewage
Trump deemed the landmark civil rights agreement “illegal DEI and environmental justice policy.”

Study: Maui’s Plan to Convert Vacation Rentals to Long-Term Housing Could Cause Nearly $1 Billion Economic Loss
The plan would reduce visitor accommodation by 25% resulting in 1,900 jobs lost.

Why Should We Subsidize Public Transportation?
Many public transit agencies face financial stress due to rising costs, declining fare revenue, and declining subsidies. Transit advocates must provide a strong business case for increasing public transit funding.

Paris Bike Boom Leads to Steep Drop in Air Pollution
The French city’s air quality has improved dramatically in the past 20 years, coinciding with a growth in cycling.

Why Housing Costs More to Build in California Than in Texas
Hard costs like labor and materials combined with ‘soft’ costs such as permitting make building in the San Francisco Bay Area almost three times as costly as in Texas cities.

San Diego County Sees a Rise in Urban Coyotes
San Diego County experiences a rise in urban coyotes, as sightings become prevalent throughout its urban neighbourhoods and surrounding areas.
Urban Design for Planners 1: Software Tools
This six-course series explores essential urban design concepts using open source software and equips planners with the tools they need to participate fully in the urban design process.
Planning for Universal Design
Learn the tools for implementing Universal Design in planning regulations.
Smith Gee Studio
Alamo Area Metropolitan Planning Organization
City of Santa Clarita
Institute for Housing and Urban Development Studies (IHS)
City of Grandview
Harvard GSD Executive Education
Toledo-Lucas County Plan Commissions
Salt Lake City
NYU Wagner Graduate School of Public Service