


New data technology has made it possible to measure transit equity in ways that were impossible before. TransitCenter is making good use of the new capabilities.
Questions about transit equity have, historically, been hard to answer. Recent data advances have made it more feasible to quantify information about gaps in transit service, and the communities affected by those gaps.
Now TransitCenter has built a new transit equity dashboard, as a template and a "newly-possible best practice." The Transit Center Equity Dashboard "[demonstrates] the nuance that access-to-opportunity analysis brings to equity evaluations, and to shed light on large gaps in access facing U.S. transit riders," according to the website for the new dashboard.
"This dashboard measures how well transit networks in seven U.S. cities connect people who’ve been marginalized within those metro areas to the jobs, services, and amenities they need to thrive," according to the website. "Using February 2020 as a baseline, the dashboard looks at metrics like the number of jobs people can reach within a limited timeframe or budget, travel times to hospitals and grocery stores, and service frequency, and tracks how these measures have changed in each region."
Of the seven cities, six are live on the site with stories, maps, and data: Chicago, Los Angeles, New York, Philadelphia, San Francisco-Oakland, and Washington, D.C. The dashboard for Boston is coming soon.
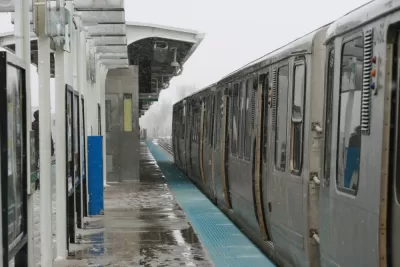
As an example of the "story" included with the dashboard for each of the cities, Chicago is revealed to provide less transit service to Black and Lantinx residents compared to other groups. Trips for healthcare and grocery shopping are also likely to take longer, due to transportation and development patterns.
Laura Bliss shares news and insight into the findings of the new dashboard in an article for Bloomberg CityLab. The headlining takeaway from that article: transit service cuts during the pandemic have yet to be restored in many places, and many riders continue to suffer the consequences.
There is a mountain of data to explore for each city on the dashboard. Start exploring at the link below.
FULL STORY: Tracking Transit Equity in US Cities

DC Improving Transit Equity
The Transit Equity Dashboard reveals a more marked improvement in transit access in the District of Columbia than in other metro areas.
D.C. Transit Recovery ‘Slow and Bumpy’
Transit service in the District has not yet recovered to pre-pandemic levels, with Black and low-income riders feeling the brunt of the impact.

Equity and Transit Go Hand in Hand for the Pandemic Recovery
Equity illuminates the light at the end of the tunnel for U.S. transit agencies, according to a recent report by the Urban Institute.

Study: Maui’s Plan to Convert Vacation Rentals to Long-Term Housing Could Cause Nearly $1 Billion Economic Loss
The plan would reduce visitor accommodation by 25,% resulting in 1,900 jobs lost.
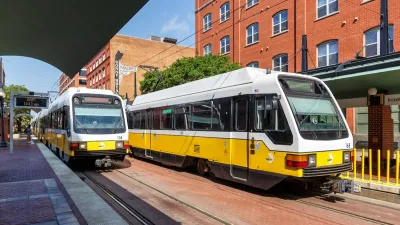
North Texas Transit Leaders Tout Benefits of TOD for Growing Region
At a summit focused on transit-oriented development, policymakers discussed how North Texas’ expanded light rail system can serve as a tool for economic growth.

Why Should We Subsidize Public Transportation?
Many public transit agencies face financial stress due to rising costs, declining fare revenue, and declining subsidies. Transit advocates must provide a strong business case for increasing public transit funding.
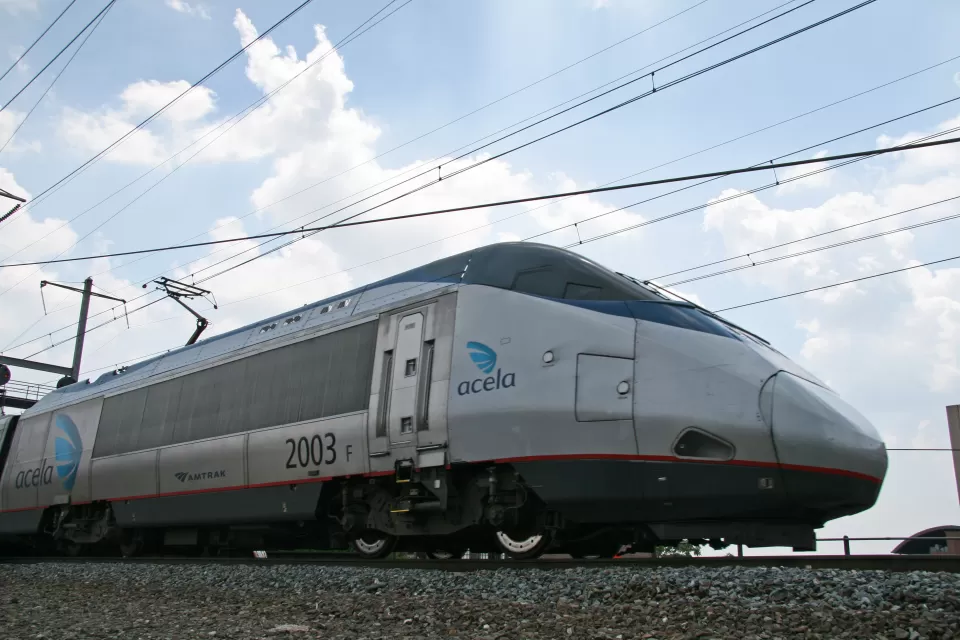
How to Make US Trains Faster
Changes to boarding platforms and a switch to electric trains could improve U.S. passenger rail service without the added cost of high-speed rail.

Columbia’s Revitalized ‘Loop’ Is a Hub for Local Entrepreneurs
A focus on small businesses is helping a commercial corridor in Columbia, Missouri thrive.

Invasive Insect Threatens Minnesota’s Ash Forests
The Emerald Ash Borer is a rapidly spreading invasive pest threatening Minnesota’s ash trees, and homeowners are encouraged to plant diverse replacement species, avoid moving ash firewood, and monitor for signs of infestation.
Urban Design for Planners 1: Software Tools
This six-course series explores essential urban design concepts using open source software and equips planners with the tools they need to participate fully in the urban design process.
Planning for Universal Design
Learn the tools for implementing Universal Design in planning regulations.
Ascent Environmental
Borough of Carlisle
Institute for Housing and Urban Development Studies (IHS)
City of Grandview
Harvard GSD Executive Education
Toledo-Lucas County Plan Commissions
Salt Lake City
NYU Wagner Graduate School of Public Service