


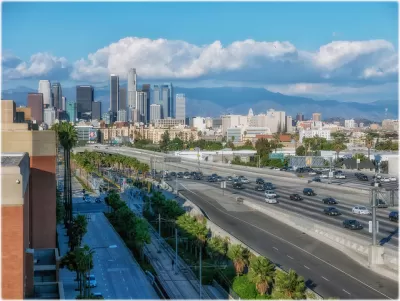
Overall greenhouse gas emissions in California dropped 1% in 2017, according to the inventory by the California Air Resources Board, which includes a 9% drop in emissions from electricity generation and a 1% increase in transportation emissions.
San Francisco Chronicle reporter covering energy. "The state is now well past its 2020 goal of reducing greenhouse gas levels to 1990 levels — 431 million metric tons."
or the first time since the state began tracking greenhouse gas emissions, powered most [52%] of the state’s electric grid," notes Morris.
Electricity generation, from in-state and out-of-state sources, accounted for 15 percent of greenhouse gas emissions by economic sector, the third-highest after transportation (41%) and industrial (24%).

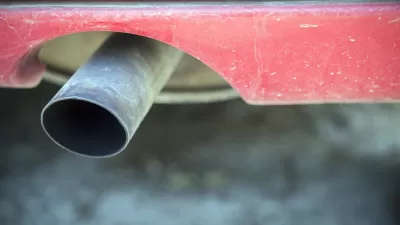
The news is not so positive when it comes to transportation. For the fifth consecutive year, emissions have increased, although the increase in 2017 was "the lowest growth rate over the past 4 years," notes the second bullet in the executive summary of the 24-page report, California Greenhouse Gas Emissions for 2000 to 2017 [pdf]. Vehicle tailpipe emissions accounted for 37% of emissions in 2017.
Emissions from oil refineries, which are included in the industrial, not the transportation, sector, also increased, reports Melanie Curry for Streetsblog California.
What continues to be overwhelmingly positive is the economic and demographic relationships with greenhouse gas emissions, shown by the inverse relationship between emissions and both GDP and population, i.e., as GDP and population increase, emissions decrease. Do note, though, that the population line has begun to flatten.

In 2017, the California economy grew at 3.6 percent – 1.4 percent above the national average, according to the state Department of Finance. "Katelyn Roedner Sutter, manager of U.S. climate for the Environmental Defense Fund, called it a strong sign that reducing emissions does not have to restrict economic growth," adds Morris.
“You can decouple them,” she said. “You can grow your economy and reduce emissions at the same time.”
The relationship between emissions, GDP and population was a major focus of Planetizen's first post the Air Resources Board's GHG inventory reports – the 2017 edition (measuring 2015 emissions). Subsequent posts dealt with the transportation challenge, as does Morris:
“We’ve kind of wrung out the easy stuff from the electric sector, and I think we’re going to now be turning toward the more challenging sectors,” said James Bushnell, a UC Davis economics professor who has advised the air resources board on climate policy. “We haven’t really figured out the effective means to do the reduction in those sectors, as we’ve done with electricity.”
Last year's report by the Legislative Analyst's Office, "Assessing California's Climate Policies—Transportation," came to the same conclusion:
Based on our review of the various polices designed to reduce GHG emissions in the transportation sector, we identified several important takeaways.
Broadly, we find that: (1) overall economic effects, including effects on GHG emissions, are unclear; (2) the large number of different policies creates various challenges for such things as program coordination and evaluation; and (3) the policies are generally more costly strategies to reduce GHGs than alternatives, such as cap‑and‑trade, although they could provide other important benefits in certain limited circumstances.
[The report was also referenced in last May's post, "As EV Sales Soar, Transportation Emissions Continue to Increase."]
CalMatter's environment reporter, Julie Cart, also referenced the LAO report in her Aug.15 article, "Can California put cars in the rear-view mirror?" that appears partly based on the Air Resources Board's GHG Inventory report.
“You are talking about persuading (millions of) individual car drivers in the largest state in the union to drive zero-emission vehicles, or take public transportation, or ride a bike, or walk, or rideshare,” said former state senator Kevin de León, who authored the law that sets California on a course to 100% clean energy, “We drive internal-combustion cars in part because they are easy.”
For more information:
- The Air Resources Board's Greenhouse Gas Inventory webpage
- California Greenhouse Gas Emission Inventory Program
- The 24-page GHG Emissions Trends Report: 2000 to 2017 [pdf]
Related in Planetizen:
-
California Reaches Greenhouse Gas Emissions Target Four Years Ahead of Schedule [2018 Edition], July 13, 2018
-
California Progress Report: GDP Increases While GHGs Fall [2017 Edition], June 10, 2017
FULL STORY: Clean energy powers California climate emissions drop

As EV Sales Soar, Transportation Emissions Continue to Increase
California has embraced electric vehicles like no other state, with success reflected in increased sales and registration data, yet transportation emissions have increased for the last four years, primarily from light-duty vehicles.
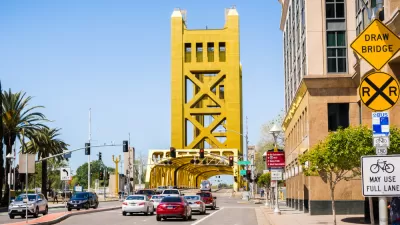
Sacramento Hopes to Lead Transportation Emission Reductions by Example
As California tries to stem its increasing greenhouse gas emissions from the transportation sector, its capital, Sacramento, may prove to be a model for other cities as it embraces electric vehicles and strategies to reduce driving.

California Achieved its Climate Goal; Now the Hard Part Begins
New York Times climate reporter, Brad Plumer, comments on California's landmark accomplishment in reducing emissions, observing that with the low-hanging electricity generation fruit picked, reducing transportation emissions will prove formidable.

Alabama: Trump Terminates Settlements for Black Communities Harmed By Raw Sewage
Trump deemed the landmark civil rights agreement “illegal DEI and environmental justice policy.”

Study: Maui’s Plan to Convert Vacation Rentals to Long-Term Housing Could Cause Nearly $1 Billion Economic Loss
The plan would reduce visitor accommodation by 25% resulting in 1,900 jobs lost.

Why Should We Subsidize Public Transportation?
Many public transit agencies face financial stress due to rising costs, declining fare revenue, and declining subsidies. Transit advocates must provide a strong business case for increasing public transit funding.

Paris Bike Boom Leads to Steep Drop in Air Pollution
The French city’s air quality has improved dramatically in the past 20 years, coinciding with a growth in cycling.

Why Housing Costs More to Build in California Than in Texas
Hard costs like labor and materials combined with ‘soft’ costs such as permitting make building in the San Francisco Bay Area almost three times as costly as in Texas cities.

San Diego County Sees a Rise in Urban Coyotes
San Diego County experiences a rise in urban coyotes, as sightings become prevalent throughout its urban neighbourhoods and surrounding areas.
Urban Design for Planners 1: Software Tools
This six-course series explores essential urban design concepts using open source software and equips planners with the tools they need to participate fully in the urban design process.
Planning for Universal Design
Learn the tools for implementing Universal Design in planning regulations.
Smith Gee Studio
Alamo Area Metropolitan Planning Organization
City of Santa Clarita
Institute for Housing and Urban Development Studies (IHS)
City of Grandview
Harvard GSD Executive Education
Toledo-Lucas County Plan Commissions
Salt Lake City
NYU Wagner Graduate School of Public Service