


The inventory, a requirement from a 1992 U.N. treaty, shows emissions from most sectors are either decreasing or holding steady. The major exception: transportation.
The U.S. Environmental Protection Agency met its requirement under the U.N. Framework Convention on Climate Change, signed by President George H. W. Bush on October 13, 1992*, by releasing the draft on Feb. 7.
"The agency's inventory shows that the United States, the world's richest nation, released 15 percent of global carbon dioxide emissions in 2015," reports Jean Chemnick, who covers international climate policy for Climatewire.
It also shows that U.S. emissions in 2016 were 11.6 percent lower than in 2005, a downward trajectory supported by the power sector's shift from coal to natural gas. Warmer winters also contributed to that drop.
[See EPA webpage for introduction and access to "Inventory of U.S. Greenhouse Gas Emissions and Sinks" or go directly to the 649-page draft inventory [pdf]. Two figures from the report are referenced below and identified by page number.]
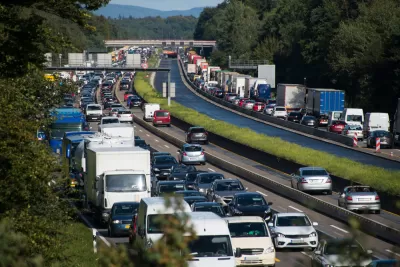
Emissions from the transportation sector, on the other hand, have been increasing since 2013, though still below their 2008 peak, as Figure ES-14: U.S. Greenhouse Gas Emissions Allocated to Economic Sectors [million metric tons of carbon dioxide equivalents (MMT CO2)] on pg. 49/649 [or pg. ES (Executive Summary) - 24. Also accessible by clicking on the respective link in the Table of Contents: List of Tables, Figures, and Boxes, beginning on page IX.
While the graph, which ends in 2016, shows emissions from the electric power industry and transportation essentially tied at total emissions, transportation took the unenviable #1 position that year when measuring just carbon emissions, according to a June post in Planetizen:
"For the first time since 1979, America’s cars, trucks, and airplanes emit more carbon dioxide than its power plants do," according to an article by Brad Plumer.
The increase in transportation emissions, resulting from an increase in petroleum consumption, correlates with an increase in vehicle miles traveled and a leveling in the fuel economy of new vehicles sold, stalled at roughly 25 mpg since 2014, according to monthly monitoring records by the Sustainable World Foundation, University of Michigan Transportation Research Institute.
Petroleum was far away the #1 contributor to carbon dioxide emissions in 2016, accounting for 44.1 percent, with natural gas and coal contributing 29.7 percent and 26.3 percent, respectively, according to Figure ES-6: 2016 CO2 Emissions from Fossil Fuel Combustion by Sector and Fuel Type [pg. 36/649, or Executive Summary ES-11.]
"The third-largest contributor of emissions in 2016 was forests, due to an unusually active wildfire season," adds Chemnick.
- See EPA instructions for submission of comments by March 9.
- *Three years before signing the U.N. Framework Convention on Climate Change, President George H.W. Bush established the U.S. Global Change Research Program that requires Federal agencies and departments to prepare an annual National Climate Assessment.
- E&E News is subscription-only. I wasn't able to locate any other articles on the release of this important inventory.
Hat tips to Darrell Clark and Ned Ford.
FULL STORY: UNITED NATIONS: U.S. releases CO2 inventory required by climate treaty

Methane Emissions Replace CO2 Emissions— Is This Progress?
For the first time, electricity generated from burning natural gas will surpass coal, largely due to fracking of shale. While that means that carbon dioxide emissions will continue to drop, it also means that methane emissions will increase.

Major Increase in Global Carbon Emissions Projected for 2018
The report from the Global Carbon Project, an international group of scientists who track greenhouse gas emissions, comes as a surprise as emissions had been relatively flat for the last four years. Global emissions this year will increase 2.7%.
Legal Loophole Will Allow Rollback of Fuel Efficiency Standards
On Tuesday, the Trump administration anticipates unraveling two signature Obama environmental regulations: fuel efficiency standards for model year 2022-2025 light-duty vehicles and beginning the undoing of the Clean Power Plan.

Alabama: Trump Terminates Settlements for Black Communities Harmed By Raw Sewage
Trump deemed the landmark civil rights agreement “illegal DEI and environmental justice policy.”

Study: Maui’s Plan to Convert Vacation Rentals to Long-Term Housing Could Cause Nearly $1 Billion Economic Loss
The plan would reduce visitor accommodation by 25% resulting in 1,900 jobs lost.

Planetizen Federal Action Tracker
A weekly monitor of how Trump’s orders and actions are impacting planners and planning in America.

Wind Energy on the Rise Despite Federal Policy Reversal
The Trump administration is revoking federal support for renewable energy, but demand for new projects continues unabated.

Passengers Flock to Caltrain After Electrification
The new electric trains are running faster and more reliably, leading to strong ridership growth on the Bay Area rail system.

Texas Churches Rally Behind ‘Yes in God’s Back Yard’ Legislation
Religious leaders want the state to reduce zoning regulations to streamline leasing church-owned land to housing developers.
Urban Design for Planners 1: Software Tools
This six-course series explores essential urban design concepts using open source software and equips planners with the tools they need to participate fully in the urban design process.
Planning for Universal Design
Learn the tools for implementing Universal Design in planning regulations.
Caltrans
Smith Gee Studio
Institute for Housing and Urban Development Studies (IHS)
City of Grandview
Harvard GSD Executive Education
Toledo-Lucas County Plan Commissions
Salt Lake City
NYU Wagner Graduate School of Public Service