


Planetizen's annual list of the best of the planning Internet in a year inextricably defined by the uncertainty and constraints of the COVID-19 pandemic.
The events of the year have shown with intense clarity the deep and broad intersectionality of planning. It is nearly impossible to extract consideration of the public health, economic, and social risks of the pandemic from a discussion of planning, both in practice and in theory.
This intersectionality of planning extends to the digital realm. The pandemic has brought new attention to the power of the Internet as a tool for building and protecting the world, and planning expertise has been essential in every new phase of this ordeal. Digital tools like those below, and others like them, will continue to empower effective action as the world begins to pick up the pieces of 2020 and, hopefully, undertake a regenerative recovery in 2021 and beyond.
Earlier this year, Planetizen surveyed the many examples of useful and powerful online tools tailored to understanding and responding to the pandemic. Rather than focusing solely on the pandemic, the following list will acknowledge the advancements of the planning Internet in context of the pandemic.
This year's list of Top Websites was created with the same criteria and methodology as previous years, dating all the way back to 2011. The Planetizen team requested submissions for this year's list via email and monitored the planning Internet throughout the year to generate nominees before curating this list.
This list is by no means comprehensive, and we hope readers will add more examples of the best of the planning Internet in the comments below.
News
City Monitor

In a year marked by the decline and consolidation of media outlets, including numerous examples of urbanism-focused media, City Monitor has distinguished itself by hiring top talent and redoubling its commitment to quality journalism. Sommer Mathis, founding editor of Bloomberg CityLab (née CityLab née Atlantic Cities) and former editor-in-chief of Atlas Obscura, was hired as the new editor-in-chief at City Monitor at the beginning of the year. Soon after, urbanism journalism luminaries like Allison Arieff and Jake Blumgart, among others, signed on. If you haven't already, add City Monitor to your bookmarks of essential planning and urbanism reading.
Social Media
NUMTOTS

The New Urbanist Memes for Transit-Oriented Teens Facebook group is probably the most popular media platform for the topics of planning. It's changed the game of urbanism-focused media, all while using a social media platform considered by many younger people as passé (in addition to being considered by people of all ages as evil). Despite the limitations of the platform (or perhaps because of them), NUMTOTs have found a way to package the foundational concepts of the contemporary planning debate into an eminently consumable and engaging chunks. Along the way, the NUMTOTs have inspired numerous spinoffs, plenty of debate (much of that debate can't be described as civil, to be fair), and more than one moment in the mainstream media spotlight (e.g., The Guardian, The New York Times, and Chicago magazine). We daresay that this collective has succeeded in achieving sustained and impassioned interest in the subjects planning at a level unprecedented in the history of planning media.
Maps
Planetizen is always on the lookout for the most useful interactive maps and data illustrations.
MTA Live Subway Map

The appearance of the MTA's Live Subway Map's appearance on this map speaks to the historic occasion that marks any update of the map used by millions of New Yorkers, residents of the surrounding region, and visitors from around the world every year. The MTA revealed the new subway map in October 2020, implementing significant alterations to the design of the map and opening a new chapter in the history of graphic design (previous iterations of the map inspired passionate debate among graphic designers and transit users). The graphic design changes weren't the only features of note in this new map—the map also offers train locations in real time, even on the mobile version of the map. Some criticism of the map has emerged since a triumphant debut, but this is the map is the new standard against which all other U.S. transit maps are now judged.
Transit Costs Project
![]()
The cost of public transit projects in the United States, climbing faster and ever higher, is proof that the laws of physics don't apply to planning. The laws of politics certainly do, however, and fiscal conservatives have scored numerous victories at the expense of non-automotive modes of transportation over the years because of the huge costs attached to public transit. Recently transit boosters have also adopted an anti-waste stance regarding capital investments in transit, in the hopes of doing more with meager allotments as well as building a solid case for transit as a wise investment of tax payer dollars. Alon Levy led the way on this new kind of scrutiny on public transit spending, concentrating on the Second Avenue Subway in New York City, but the same questions about out of control transit spending could be raised all over the country. As a result of this attention to the country's transit spending problems, the Eno Center for Transportation started the year by announcing the first program of scientific inquiry into the problem. The Transit Costs Project, led by researchers at the NYU Marron Institute of Urban Management, puts these big questions in illustrative, geographic context with the power of online, interactive maps.
Morphocode Explorer

The Morphocode Explorer accomplishes an incredibly holistic advancement for the urban analysis genre of digital tools. The Explorer shines a literal spotlight on data indicators of relevance to planning and urban design, public works and services, the real estate market, and mobility. Morphocode Explorer is just one project of many created by the Morphocode team, but it's redefining the potential of interactive maps to reveal and illustrate data, building on the work of famous predecessors like the Urban Layers project. Helpfully, the Morphocode team has also written both a blog post and a 30-page playbook detailing the design and development process that created the Explorer.
15-Minute City App

The 15-minute city is the buzzword of the year in the online discussion of planning, following in the footsteps of terms like Missing Middle Housing, Tactical Urbanism, and Accessory Dwelling Units, for a few examples, in capturing the imagination of politicians and the general public. The 15-Minute City app borrows from concepts deployed by examples like the WalkScore and TransitScore websites to generate maps that show the number of essential services located in U.S. neighborhoods. The timing of the 15-Minute City's ascendence in the public consciousness is not entirely coincidental. As the world got small for the many millions who spent the year hunkering down to prevent contracting and spreading a terrible disease, the lack of access to essential services in proximity to residential neighborhoods added another brutal confrontation with the built environment among many this year. For many, the rational response to the risks of the pandemic was to move farther afield of the neighborhoods that already embody the characteristics of a 15-Minute City, making this app the right app for the right time and place.
COVID-19
The speed at which these resources were set up, and their incredible utility, will provide a model for the power and flexibility of the planning Internet for years to come.
Brookings Metro Recovery Index

There are so many details involved with the big picture of the pandemic crisis that it can be easy to lose track of the narrative. The Metro Recovery Index presents data and rankings on a number of critical indicators from the labor and real estate markets as well as from the broader economic activity of all 192 U.S. metro areas with at least 250,000 residents. The website also provides specific focus on indicators in the 53 U.S. metro areas with more than a million residents. The consequences of the pandemic vary by location, but careful presentation of data like this can help make sense of this world.
Transit App Coronavirus Ridership Tracker
![]()
The Transit app is a perennial inclusion on the Planetizen Top Apps list, given its best-in-class presentation of transit system schedules and maps. Early in the pandemic, the team at the Transit app leveraged its popularity to provide up-to-date data on transit ridership in cities around the world. Eventually, the American Public Transportation AssociationTransit even integrated the Transit app's data into its own website to track ridership trends. In the United States, the crisis facing transit agencies gutted by reduced ridership, declining revenues, and employees on the frontlines of the public health crisis is still far from resolved, and information like the data found here makes the case for the absolute necessity of public transit to an equitable society.
United States Census Bureau COVID-19 Demographic and Economic Resources

The U.S. Census Bureau was in the news a lot this year, due to the unfortunate coinciding of the pandemic with the 2020 biennial Census and a presidential election. The concern over the ability of the Census to be completed during a pandemic and under the influence of the destructive tendencies of the Trump administration speaks to the existential crisis facing democracy in the United States in 2020, but with the COVID-19 Demographic and Economic Resources website, the Census proved its immense utility. Data created by the Weekly House Pulse Survey, especially, was able to shine a light in some of the darkest moments of the year.
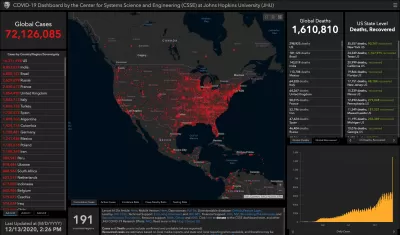
COVID-19 Dashboard by the Center for Systems Science and Engineering (CSSE) at Johns Hopkins University (JHU)

The JHU COVID-19 dashboard was the first COVID-19 mapping resource that many people encountered when waking up to the potential threat of the coronavrus in the late days of 2019 and early days of 2020. If you haven't been back to the JHU dashboard, favoring infographics that have been built-out since by the Los Angeles Times, New York Times, or Google, for example, you'll be shocked to see how the numbers have climbed since the days that China led the number of infections worldwide. A large amount of credit must be given to the data, funding, and mapping sources that have built this tremendous resource. In a world that's hard to imagine, it's very hard to imagine this world without these resources.
The Other Existential Crisis
MIT Climate Portal

The MIT Climate Portal has the best of all worlds: great data presentation, cutting edge design, and clear explainer posts. It shows the many ways the Internet can be leveraged for the education of audiences on critical subjects like climate change, which, if the pandemic of 2020 and 2021 is any indication, will require a lot more education to marshal the collective action necessary to prevent the worst possible outcomes.


Planning and the Pandemic: Trends From 2020
If ever there was a doubt about the sheer depth and breadth of intersectionality found in the practice and theory of planning, the pandemic provides daily reminders.

Urban Planning and the Coronavirus: 2020 Year in Review
If ever there was a doubt about the sheer depth and breadth of intersectionality found in the practice and theory of planning, the pandemic provides daily reminders.

Nine Months Later: How the Pandemic Is Changing Communities
Planetizen shares the latest in a series of compendia tackling the effects of the pandemic, now and in the future, for cities and communities.

Alabama: Trump Terminates Settlements for Black Communities Harmed By Raw Sewage
Trump deemed the landmark civil rights agreement “illegal DEI and environmental justice policy.”

Planetizen Federal Action Tracker
A weekly monitor of how Trump’s orders and actions are impacting planners and planning in America.

How Atlanta Built 7,000 Housing Units in 3 Years
The city’s comprehensive, neighborhood-focused housing strategy focuses on identifying properties and land that can be repurposed for housing and encouraging development in underserved neighborhoods.

Report: Zoning Reforms Should Complement Nashville’s Ambitious Transit Plan
Without reform, restrictive zoning codes will limit the impact of the city’s planned transit expansion and could exclude some of the residents who depend on transit the most.

Judge Orders Release of Frozen IRA, IIJA Funding
The decision is a victory for environmental groups who charged that freezing funds for critical infrastructure and disaster response programs caused “real and irreparable harm” to communities.

‘Clybourne Park’ Sets Stage for Housing Equity Discussions
Clybourne Park, a play exploring race, real estate, and community tensions, can set the stage for discussion on the lasting impacts of housing discrimination, gentrification, and the fight for affordability.
Urban Design for Planners 1: Software Tools
This six-course series explores essential urban design concepts using open source software and equips planners with the tools they need to participate fully in the urban design process.
Planning for Universal Design
Learn the tools for implementing Universal Design in planning regulations.
Caltrans
Smith Gee Studio
Institute for Housing and Urban Development Studies (IHS)
City of Grandview
Harvard GSD Executive Education
Toledo-Lucas County Plan Commissions
Salt Lake City
NYU Wagner Graduate School of Public Service