


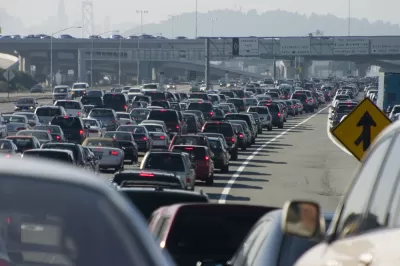
Here are a few transportation-related facts that might have slipped through the cracks in the current political debate regarding infrastructure spending.

Infrastructure funding has been garnering increased national attention since the last presidential election. No doubt, some of the delay in rolling out an infrastructure initiative has been the challenge inherent in finding a funding strategy that would attract support. In determining a path forward for transportation infrastructure funding, it’s important to reflect on current trends.
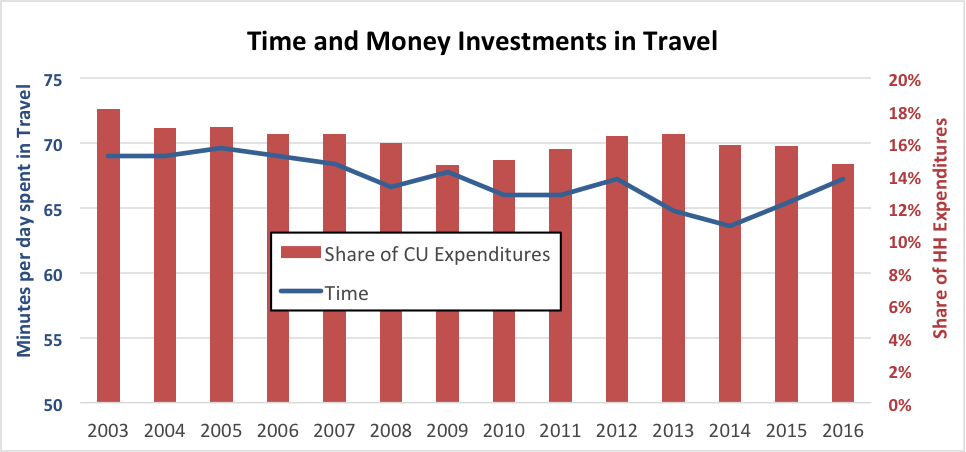
In 2016 the average American Consumer Unit spent $8,427 on auto travel or 14.7% of their annual expenditures, according to the Consumer Expenditure Survey. That same year, according to the American Time Use Survey, the average American 15 years old and older spent 409 hours traveling. Thus, the average 15+ year old American spent over an hour and about $10 on travel every day. Perhaps most relevant, they spent less time and a lower share of spending than they did a decade ago.
Not surprisingly, the time spent on travel rebounded some as the economy improved—more money to participate in activities and pay for travel and perhaps more time spent traveling partially due to more congestion. Yet, the share of household spending for travel has continued to dip. Cheap gas (at least cheap compared to what most of the rest of the world pays), low-cost interest, and softer used car prices as strong new car sales ramped up the used-car inventory are contributing to lower spending on travel. Perhaps some substitution of communications for travel (telecommuting, e-commerce, etc.), an aging population, and competition for consumer dollars from health care and housing are contributing. In spite of population growth, there are over 1 million fewer people living in zero-car households than there were two years ago and over 1.4 million fewer people living in single car households, but nearly 5.4 million more people living in households with two or more vehicles. More cars—less spending.
Maybe part of the reason for the decrease in spending is because we’re not extracting enough resources from travelers to maintain and enhance the transportation infrastructure.
One can derive any number of observations by looking at these trends. First, the cost of travel captured by household expenditures is a declining share of total household expenditures[i]. Had it retained the same share as in 2003, each household would have spent nearly $2,000 more on travel in 2016. For context, the recent U.S. Chamber of Commerce recommendation for a $0.25 per gallon increase in the fuel tax would have resulted in approximately an additional $225 per year in fuel tax bills for the average household. Even with no economizing in travel or vehicle efficiency improvements, a $0.25 per gallon increase in gas taxes would have still left each household $1,775 better off than in 2003, and still spending well under a nickel per mile toward roadway infrastructure (and other highway trust fund diversions) via gas taxes.
To a certain extent, the consumer expenditure data is a little misleading. Even ignoring externalities, the survey only captures direct transportation expenses by households. But by policy, we have been moving away from user-based funding. More of the costs of transportation are being paid for by non-user, fee mechanisms. Sales taxes, property taxes, and other general revenue sources are paying for transportation at the local and at the state level in some locations. Thus, the consumer expenditure survey is unable to parse out other taxes that support transportation in a way that allows them to be attributed as transportation expenditures. This is particularly true for expenditures on public transportation, where most costs are not borne by the traveler and sales and property taxes are common revenue sources. For example, at the high end of the spectrum, the tax package approved by voters in Seattle in fall 2016 was estimated to increase an average household’s spending on taxes and fees for transit by $326 annually on top of $303 in pre-existing transit taxes. These do not show up on the consumer expenditure survey data. Seattle is not typical, and transit is certainly not alone as local communities regularly dip into various general funds for roadways, bike and pedestrian transportation infrastructure, and operations. Transportation infrastructure costs for local roads are often captured in land and building development costs and likewise not attributable as transportation expenditures.
In addition to reduced reliance of user fees, nobody is currently paying for an increasing share of federal spending on transportation. The growing subsidies from the general fund, not backed by transportation user fees but by the, so far, good faith and credit of federal borrowing, suggest future generations will be bearing some of the cost of our transportation spending. For example, the FAST Act; P.L. 114-94 [pdf], which authorized spending on federal highway and public transportation programs through September 30, 2020, provided $70 billion in general fund transfers to the HTF to support the programs over the five-year life of the act.
This movement away from direct user fee funding strategies decouples the relationships between beneficiaries and funding and disconnects the feedback loop between behaviors and consequences. Specifically, it diminishes the sensitivity of vehicle choice decisions (think fuel efficiency) and travel decisions (number of trips, trip length and mode) to the direct costs of those decisions.
Additionally, and perhaps more important, not having to pay for things mutes decision-makers’ sensitivity to project costs. The payees, the people that would normally be weighting in with some saying “It’s not worth it” or “I’m not willing to pay for it” are toddlers or not yet born. Those remaining few who express concerns about deficit spending are often dismissed with comments about how de minimis a project is in the context of the total deficit and how compelling its benefits are. While it is comforting to pretend we are building infrastructure for the next generation’s benefits, many would argue we are depreciating the toils of the prior generation and hardly leaving the next generation better off in terms of infrastructure.
Another way to think about spending on transportation is to put various numbers in context. Federal data indicates approximately $160 billion per year is spent to build highways. Various sources estimate 55 percent of transportation trust fund user fee revenues can be attributed to household vehicle fuel taxes and fees (the balance coming from freight and commercial vehicle fees). Consumer expenditure data indicates that households are expending approximately $1.1 trillion annually for transportation, exclusive of public transportation modes. Thus, spending going toward roadway capital and operations is approximately 8% of total consumer spending on transportation (excluding airline and public transportation expenditures).
Time use data indicates that persons in the U.S. 15 years old and older collectively spend approximately 106.9 billion hours per year in travel. Congestion analyses indicate approximately 6.9 billion hours of delay are incurred by individuals and passengers in their daily travels (excluding professional drivers traveling as part of their work). Thus, travelers spend about 7% more time on travel because of roadway congestion—about five minutes per adult per day.
These numbers have a couple of implications. First, public spending on transportation infrastructure is a modest share of total spending on transportation with the vast majority of consumer transportation spending directed to purchasing, maintaining, and operating vehicles. Increasing the amount spent on transportation infrastructure would be modest in the context of total transportation spending and far less than the savings that have accrued through reduced fuel prices and other reductions in transportation spending by consumer units. Meaningful increases in user fees to support transportation infrastructure would not be a significant factor in travelers’ transportation spending.
However, congestion, something of a surrogate measure for the need for transportation investment, is similarly not particularly significant in the context of the amount of time individuals spend on travel. The pain of congestion, on average, is not currently compelling. While miserable for those subject to much more than the average daily delay, for vast shares of the population congestion is not a critical issue. More than a quarter or households do not have any work commuters and 5 percent work at home and are thus more able to schedule travel around peak periods. The criticality of increased funding for infrastructure capacity is less apparent to significant shares of the public outside of the stakeholders or those most significantly impacted by inadequate infrastructure.
This data confirms the current dilemma. To the extent there is a solid case for more infrastructure spending for transportation, passing on the cost to travelers would not be a significant burden in the context of the breath of household transportation spending. But there’s not a particularly compelling case for extracting those funds from residents to pay for the infrastructure improvements as congestion’s impact is not crippling for most residents. In growth areas new capacity needs might have motivational traction. In other areas safety and structural integrity might carry more sway. To the extent that commercial and freight travelers are a major source of user fee funding and perhaps more sensitive to congestion and roadway condition, they may need to ramp up their engagement in infrastructure priorities and funding discussions. If we taxed opinions on infrastructure funding we might have this solved.
Unfortunately, the problem gets more complex when moving past the basic question of needing additional funding. The ever more challenging questions include:
- Should funding come from user fees or general revenues?
- What mix of direct facility specific tolls/user fees versus broad based user fees (gas tax, VMT fee) is best?
- How should responsibilities be allocated across local, state and federal programs for revenue generation? And, of course,
- How should the funds be expended by geography, mode, and program priority?
If this were easy it would have been solved by now.
The opinions are those of the author—or maybe not—but are intended to provoke reflection and do not reflect the policy positions of any associated entities or clients. [email protected].
[i] This is transportation spending excluding public transportation spending that includes airline travel.

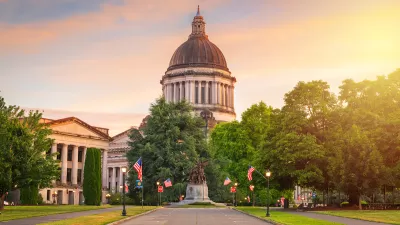
Washington State Transportation Budget Must Weigh Megaprojects, Maintenance
Major infrastructure projects face ballooning costs, putting basic maintenance and safety upgrade projects on the back burner.
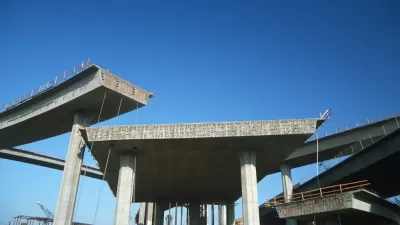
$225 Million in Federal Funding for Rural Bridge and Highway Projects Announced
The U.S. Department of Transportation this week announced the recipients of $225 million in project funding under the Competitive Highway Bridge Program. The program is reserved for projects located in mostly rural states.
Voters Approved $30 Billion for Transportation This Election
Nationwide, voters approved nearly 70 percent of transportation ballot measures on the ballot.

Alabama: Trump Terminates Settlements for Black Communities Harmed By Raw Sewage
Trump deemed the landmark civil rights agreement “illegal DEI and environmental justice policy.”

Study: Maui’s Plan to Convert Vacation Rentals to Long-Term Housing Could Cause Nearly $1 Billion Economic Loss
The plan would reduce visitor accommodation by 25% resulting in 1,900 jobs lost.

Planetizen Federal Action Tracker
A weekly monitor of how Trump’s orders and actions are impacting planners and planning in America.

Waymo Gets Permission to Map SF’s Market Street
If allowed to operate on the traffic-restricted street, Waymo’s autonomous taxis would have a leg up over ride-hailing competitors — and counter the city’s efforts to grow bike and pedestrian on the thoroughfare.

Parklet Symposium Highlights the Success of Shared Spaces
Parklets got a boost during the Covid-19 pandemic, when the concept was translated to outdoor dining programs that offered restaurants a lifeline during the shutdown.

Federal Homelessness Agency Places Entire Staff on Leave
The U.S. Interagency Council on Homelessness is the only federal agency dedicated to preventing and ending homelessness.
Urban Design for Planners 1: Software Tools
This six-course series explores essential urban design concepts using open source software and equips planners with the tools they need to participate fully in the urban design process.
Planning for Universal Design
Learn the tools for implementing Universal Design in planning regulations.
Caltrans
Smith Gee Studio
Institute for Housing and Urban Development Studies (IHS)
City of Grandview
Harvard GSD Executive Education
Toledo-Lucas County Plan Commissions
Salt Lake City
NYU Wagner Graduate School of Public Service