


Interregional bus service is the neglected stepchild of the transportation family. We need better non-auto connections between communities.

I can report from personal experience that living car-free provides a superior lifestyle. Since we gave up our car fifteen years ago we’ve been healthier, wealthier, and happier. We save lots of money, are more physically active, and are more involved in our community. This is possible because we live in a compact urban neighborhood — what I call an urban village — where most commonly used services are easy to access without driving.
However, it can be more difficult to travel far. Public transport connections to other communities ranges from moderate to terrible. For example, if we want to travel 40 kilometers west to Sooke there are 43 daily bus trips with $2.50 one-way fares, but if we want to travel 50 kilometers north to Duncan there are only four weekday trips (three on Saturday and no Sunday service) and the one-way fare is $10.
What explains this disparity? Victoria and Sooke are in the same regional district so there are clearly defined responsibilities for planning, operating, and funding transit services. However, Victoria and Duncan are in different regional districts and there is no standard process for developing interregional public transport services.
Decades ago, when automobile ownership rates were lower, private companies like Greyhound and Trailways made a profit providing interregional bus services, but declining demand resulting in a doom cycle of less ridership, less service, and less integration. Now, most communities don't even have a station; new private services are often called "curbside buses” because they pick up passengers at the side of the road.
Government agencies have failed to respond — few state or provincial transportation collect data on unmet interregional transit demands, quality of service, or funding needs. Interregional (also called intercity, long-distance, rural, or coach) bus service is the neglected stepchild of the transportation family. There are clearly defined responsibilities for planning, operating, and funding sidewalks, bikeways, local roads, public highways, rail networks, and local transit services, but not for interregional bus, as summarized in the table below.
Transportation Planning, Operating, and Funding Responsibilities
|
|
Active Modes |
Automobile |
Rail |
Bus |
|
Local |
Local Gov. |
Local/Region Gov. |
Transit agencies |
Transit Agencies |
|
Interregional |
State/Prov. Gov. |
State/Prov. Gov. |
Rail Corp. |
??? |
Planning, operating, and funding responsibilities are clearly defined for active modes (walking and bicycling), automobile, rail, and local transit services, but interregional bus is neglected.
As a result, most North American highways have no, or infrequent and expensive, interregional bus service. This recently became the butt of jokes when contestants in the BBC’s Race Across the World were required to travel with no car and limited funds from Victoria to Port Hardy, a corridor that lacks public transit — they had to hitchhike — but this inadequacy is no joke for countless non-drivers who lack convenient and affordable travel options between communities.
This is a major gap. Non-drivers have local travel options — we can walk, bike, take transit or a taxi — but without interregional transit services we lack convenient and affordable access to other areas. Inadequate interregional public transport imposes many costs on users and communities. It deprives non-drives of independent mobility, causes many motorists to bear the stress and expenses of driving on busy highways that they would prefer to avoid, forces drivers to chauffeur loved ones who cannot drive, and increases traffic problems.
Next week I will present a report on this subject, A Business Case for Improving Interregional Public Transport Service, which explores the problems caused by inadequate interregional transit, the many benefits of improving such services, and how governments can fill those gaps including examples of successful programs. Here are some highlights.
Interregional public transit demands
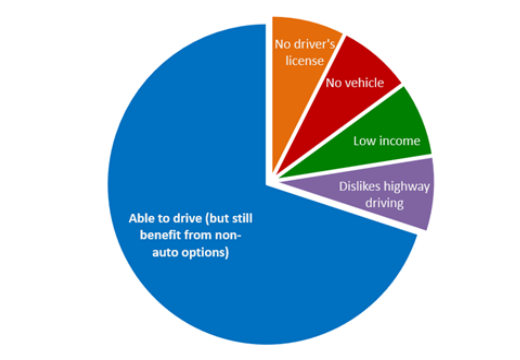
Currently, most long-distance travel is by automobile or air, but those modes cannot satisfy all users. In a typical community, 20-40% of travelers cannot, should not, or prefer not to drive, as summarized below, and will use public transit if it is convenient, comfortable, and affordable.
This is demonstrated on corridors with suitable service. For example, the bus route between Sooke and Victoria, which is frequent (43 daily trips) and affordable ($2.50 fares), serves 13 percent of total and 22 percent of peak-period trips on that corridor, but the infrequent (4 daily trips) and expensive ($10 fares) route between Duncan and Victoria carries less than 1% of trips. To increase public transit ridership we must improve frequency, comfort and affordability.
Interregional transit benefits
High-quality interregional transit services can provide significant benefits to users, motorists, and communities, as summarized below. Buses tend to be the most efficient mode of travel considering operating costs, congestion impacts, crash rates, and energy consumption.
Interregional transit benefits
Users |
Motorists |
Communities |
|
|
|
Serving multimodal travel demand can provide various direct and indirect benefits.
Interregional transit service performance evaluation
Transportation planners use performance indicators, such as levels of service (LOS) to identify problems and evaluate potential improvements. For example, a highway engineer might say, "This roadway currently has LOS C and is projected to reach LOS D in a few years, which fails our performance standards, so it should be expanded." We need similar indicators for other modes.
The table below shows level of service ratings suitable for evaluating interregional transit. High-quality service (LOS A or B) can attract discretionary travelers who would otherwise drive, and so is justified to achieve traffic problems. LOS C provides independent mobility for non-drivers. LOS D and E don’t allow travelers to visit another community and return the same day, and so are inadequate for most trips.
Interregional transit levels of service
Level of Service |
Frequency& Speed |
Affordability |
Comfort& Amenities |
Utility |
Transit Mode Share Targets |
|
A |
25+ daily trips, as fast as driving. |
Much cheaper than driving. |
Very good. Free internet, on-board washrooms, etc. |
Very high. Attracts travellers who would otherwise drive. |
15-25% |
|
B |
11-24 daily trips. |
Cheaper than driving. |
Stations with washrooms. |
High. Suitable for most trips. |
12-20% |
|
C |
5-10 daily trips. |
Slightly cheaper than driving |
Uncrowded. All passengers seated. |
Moderate. Suitable for many trips. |
6-12% |
|
D |
1-4 daily trips. |
Comparable to driving. |
Clean and comfortable. |
Low. Suitable for some trips. |
3-6% |
|
E |
Less than daily. |
More costly than driving. |
Safe vehicles and stations. |
Low. Suitable for few trips. |
1-3% |
|
F |
No service. |
Much more costly than driving. |
No amenities. |
Non-drivers lack independent mobility. |
0% |
This table defines interregional transit service quality and mode share targets. Where service varies seasonally it should be rated for average or off-peak periods.
Currently in North America, few interregional corridors have interregional transit services that are competitive in convenience and affordability with driving (LOS A and B), and many have minimal transit service (LOS D-F) that is inadequate for most travelers.
Public transportation is an essential service that helps achieve social goals including basic mobility and economic opportunity to disadvantaged groups. It also experiences economies of scale: the more people use it the lower its unit costs and the more service can be provided. These factors justify public support and subsidies to ensure that every corridors has an optimal level of transit service.
Examples of success
Canadian intercity bus services
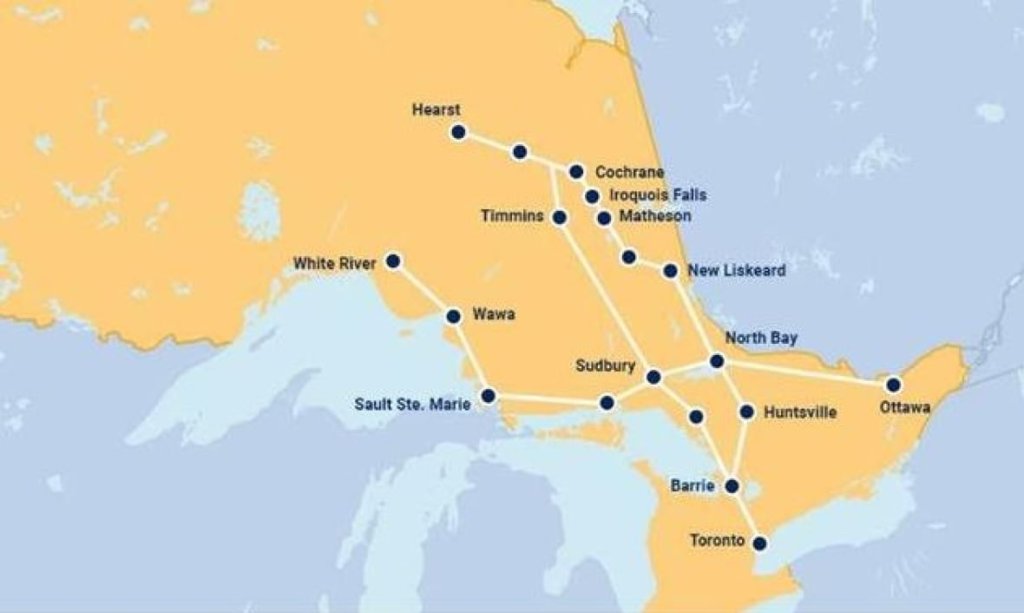
Ontario Northland, a provincial agency created in 1902, provides public transport services to numerous communities, as illustrated below. In 2022 its buses carried 281,790 passengers and 34,707 packages, and its trains carried 46,201 passengers. Of its $148 million annual budget, $95 million is from fares and $54 million (36 percent) is provincial subsidy. Similarly, between 1946 and 2017 the Saskatchewan Transportation Company provided intercity passenger and freight transport to 243 communities. It required $17 million annual subsidy, which is tiny compared with what the province spends on highways.
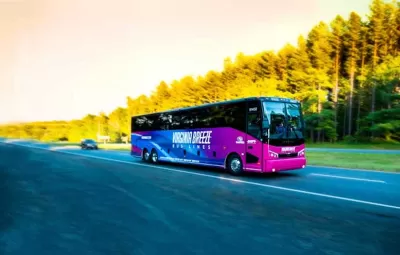
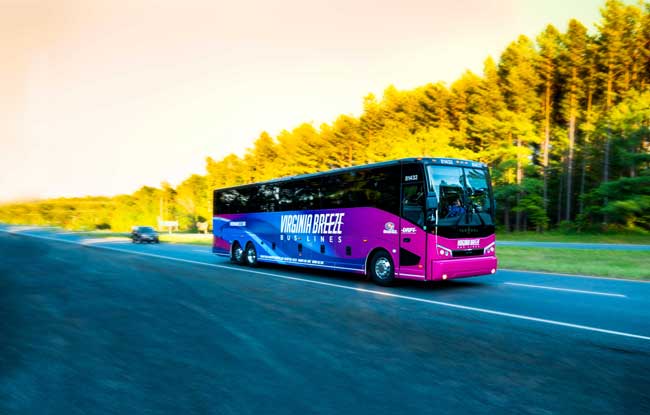
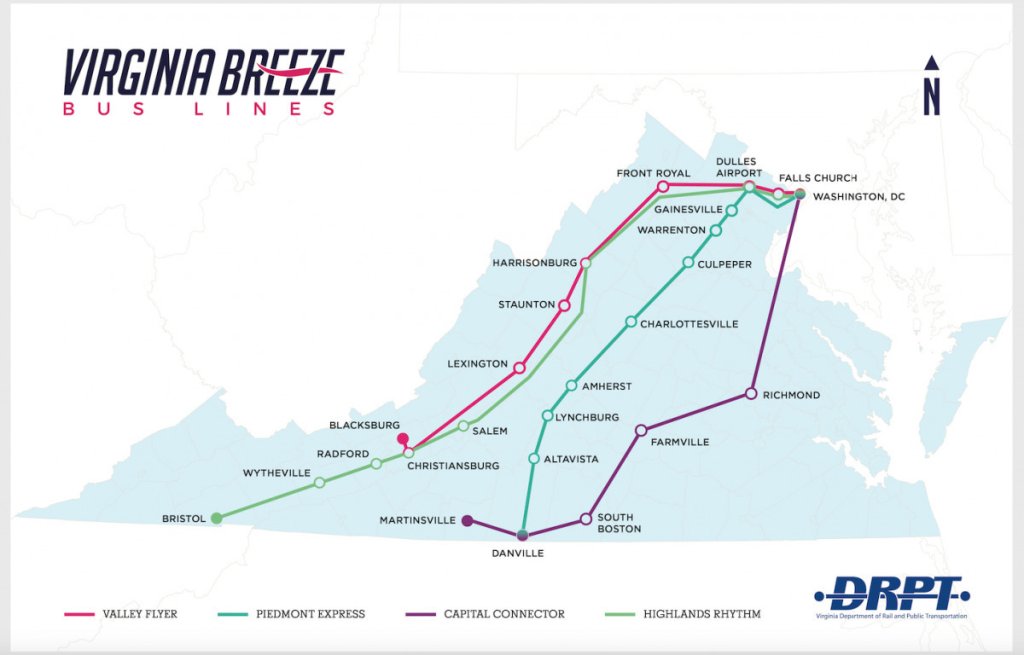
Virginia Breeze bus lines
Virginia’s Department of Rail and Public Transit (DRPT) provides interregional bus services. The first route, the Valley Flyer, connects various communities with the Dulles International Airport. With fares as low as $15, the Flyer quickly exceeded ridership expectations. With this proven success the DRPT expanded the program to include three more routes.
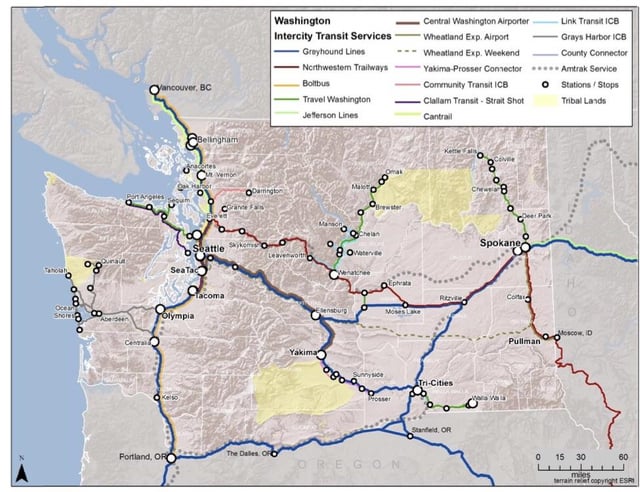
Travel Washington intercity bus and rural mobility programs
Declining intercity bus service left many Washington communities without connections to other towns and cities. In response the state created the Travel Washington Intercity Bus Program which contracts with private companies to provide bus services on major routes, as illustrated below. The State DOT works with communities to design the program and select service providers. Program Manager, Steve Abernathy, says that this approach has garnered strong community support. “When the Gold Line (northeastern Washington) was announced, communities were falling over each other to see who could bring the most to the ribbon cutting.”
Other Washington state programs to help rural communities plan, coordinate, and fund public, private non-profit, private for-profit, and Tribal transit services. As a result, most of the state's rural counties have coordinated transit services. For example, the Olympic Transit Loop consists of six coordinated local transit services that connect small communities, Indian reservations, and tourist destinations around the Olympic Peninsula.
Conclusions
A century of automobile-oriented planning has created disparities in the accessibility, comfort, and affordability between drivers and non-drivers. These are particularly large for interregional travel -- many routes lack any public transport services, or the service they have is infrequent, uncomfortable, and expensive.
For non-drivers to have independent mobility they need an integrated system that includes safe walking and bicycling conditions, local transit services, plus interregional connections. Frequent and affordable interregional bus services ensure that all travelers, including non-drivers, enjoy independence and dignity and receive a fair share of public investments. Current planning tends to overlook and undervalue many interregional bus benefits which results in underinvestment. This is unfair to non-drivers and rural communities.
This underinvestment leads to low transit mode shares. Where public transit service is convenient and affordable it typically serves 10-30% of trips, reflecting true demands. Transit experiences economies of scale. For example, higher load factors increase transit cost recovery, and busways provide more value if transit ridership increases. To optimize our transportation system transportation agencies must correct planning and funding biases that undervalue and underinvest in transit.
The key message: A highway is incomplete unless it has convenient and affordable public transit services.


The Importance of Rural Transit
On Transit Equity Day, reminding policymakers that rural communities need access to transit too.

New Intercity Bus Service Will Connect Texas Cities
A San Antonio-based charter bus company will begin offering daily trips to Dallas-Fort Worth and San Antonio later this year.

Rural Buses a ‘Lifeline’ in Colorado
Bus ridership on local and intercity buses in rural areas rose sharply even as urban transit ridership took a hit between 2019 and 2024.

Study: Maui’s Plan to Convert Vacation Rentals to Long-Term Housing Could Cause Nearly $1 Billion Economic Loss
The plan would reduce visitor accommodation by 25,% resulting in 1,900 jobs lost.
North Texas Transit Leaders Tout Benefits of TOD for Growing Region
At a summit focused on transit-oriented development, policymakers discussed how North Texas’ expanded light rail system can serve as a tool for economic growth.

Why Should We Subsidize Public Transportation?
Many public transit agencies face financial stress due to rising costs, declining fare revenue, and declining subsidies. Transit advocates must provide a strong business case for increasing public transit funding.
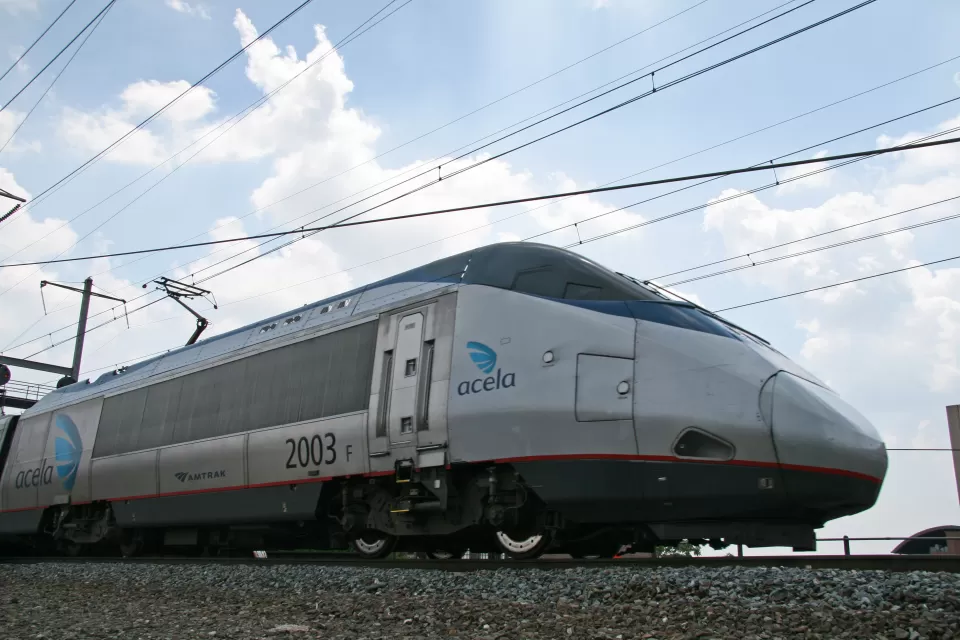
How to Make US Trains Faster
Changes to boarding platforms and a switch to electric trains could improve U.S. passenger rail service without the added cost of high-speed rail.

Columbia’s Revitalized ‘Loop’ Is a Hub for Local Entrepreneurs
A focus on small businesses is helping a commercial corridor in Columbia, Missouri thrive.

Invasive Insect Threatens Minnesota’s Ash Forests
The Emerald Ash Borer is a rapidly spreading invasive pest threatening Minnesota’s ash trees, and homeowners are encouraged to plant diverse replacement species, avoid moving ash firewood, and monitor for signs of infestation.
Urban Design for Planners 1: Software Tools
This six-course series explores essential urban design concepts using open source software and equips planners with the tools they need to participate fully in the urban design process.
Planning for Universal Design
Learn the tools for implementing Universal Design in planning regulations.
City of Santa Clarita
Ascent Environmental
Institute for Housing and Urban Development Studies (IHS)
City of Grandview
Harvard GSD Executive Education
Toledo-Lucas County Plan Commissions
Salt Lake City
NYU Wagner Graduate School of Public Service