


Is commuting Deplorable? Can we Make Commuting Great Again? It is sometimes necessary to resort to hyperbole to draw attention to real data.


Those of us who seek out new data on travel behavior trends got our annual fix this month when the U.S. Census released the 2015 American Community Survey (ACS) results. This is a good opportunity to reflect on what changed and what didn't regarding commuting in the first half of the decade. ACS is only a 1.7% annual sample but collects millions of responses. It also asks limited questions about transportation and restricts its attention to "usual" and "last week" commuting habits. Nonetheless, it does provide information on several key trends that give us insight regarding transportation.
Perhaps the most watched metric is the average commute time. The trend is shown in Figure 1.
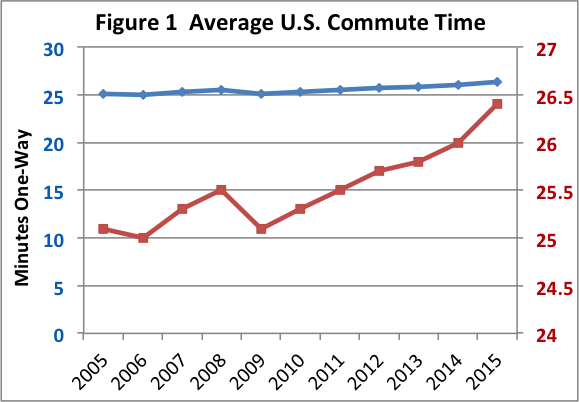
If you think things are getting deplorable, use the rust colored line and the right hand scale. The 2015 increase was the largest year-over-year increase we have seen since the start of the annual surveys. It reflects the fact that almost 2.5 million additional commuters crowded on the transportation system. A combination of congestion and/or longer trips—we cannot discern the component factors from this data—suggest that employment growth without accompanying growth in system capacity and/or better management of demand will have a travel time consequence. It reminds us of how sensitive our transportation system is to congestion. Modest increases in traffic can have meaningful impacts as crowded roads go from free flow to stop-and-go more of the time.
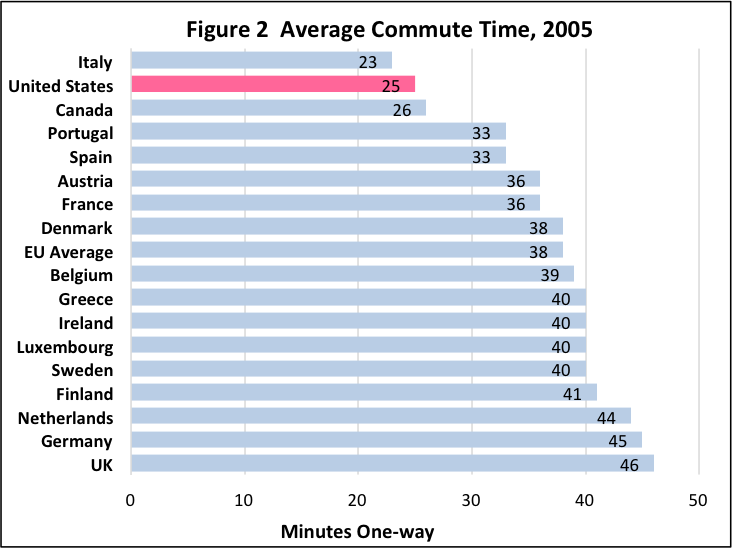
If, on the other hand you don’t think things are so bad, use the blue line on the graph—the same data, just a different vertical scale (left side). After a recession-induced pause, the average commute time is starting to resume its historic slow growth. Average commute times were 21.7, 23.4, and 25.5 minutes, in 1980, 1990, and 2000, respectively. We have yet to return to our 30-year trend of increasing commute times by approximately two minutes per decade. Besides, our commute times remain well under those in many of the countries that some planners aspire to have us be more like. Table 2 shows a sample of European data from 2005.
The second most popular piece of information from ACS is the means of commuting to work.
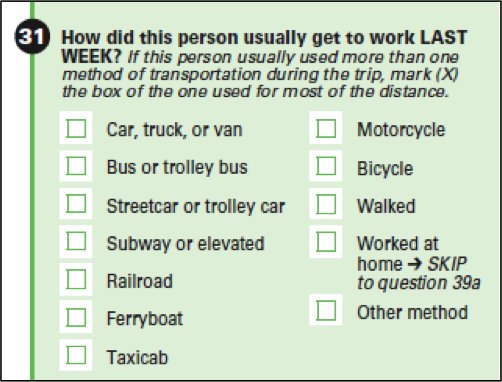
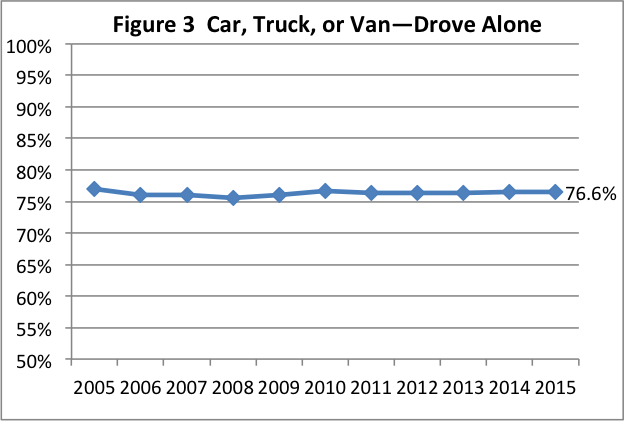
Figure 3 shows the historic trend in drive-alone commuting. After significant increases in prior decades as auto ownership increased, this trend has been virtually flat for the past 11 years.
Of more interest is the trend in the remaining modes shown in Figure 4. This figure is interesting, both for what it does show and what it does not show.
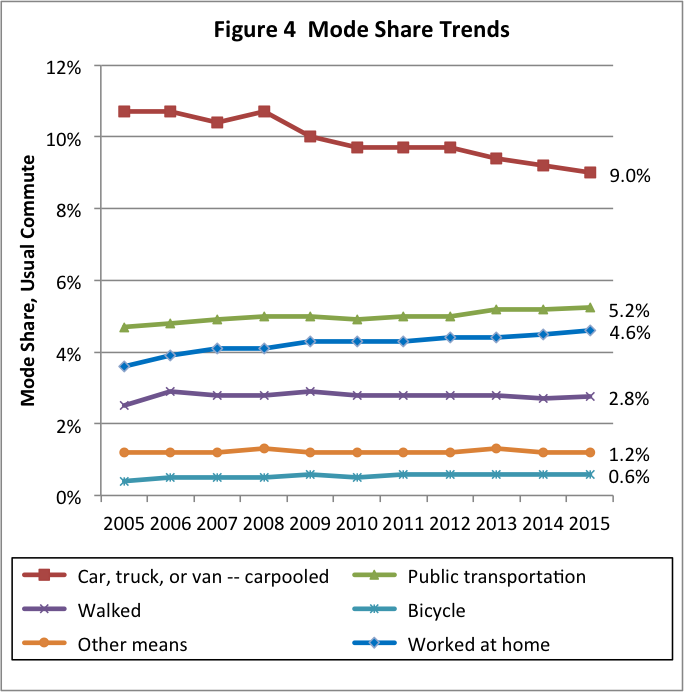
The two big movers are carpooling and work-at-home. Carpooling, or commuting to work with at least one other worker, is continuing its downward trend. The shared economy has not translated into an increased willingness to share commutes. With over 11 million new commuters since 2010, only an additional 81,000 carpooled—explaining the declining share. Planners have visions of shared rides in autonomous vehicles as critical to the environmental and economic feasibility of autonomous vehicles, so it is important to more fully understand the decline in carpooling relative to changes in other modes.
The second big mover is work-at-home. In spite of being restricted to "usual" and "last week" conditions, work-at-home has been growing steadily—slowly approaching the level of transit commuting. In spite of investments and attention, bike and walk commuting have just been holding their own as usual modes (perhaps more occasional bike and walk commuting that does not show up in measures of usual mode). Transit commuting made improvements through the recessionary years, but has stabilized the past two years.
Perhaps most striking is the fact that national averages of mode shares have not changed much. It should not be forgotten that many of these modes have increased in the number but not the share. Even with the resurgence in central business district living, differential behaviors of millennials, high and low gas prices, homeowners being locked in underwater mortgages for years, attention to active living, transportation network companies (Uber, Lyft, etc.), and myriad other factors, the fact is that national mode split trends move slowly.
Some additional fun facts:
- 26.8% of U.S. households have zero workers in them—these households may not have the same sensitivity to congestion, infrastructure needs, and accessibility to work considerations in location choice.
- 8.9% of households report no vehicle available, a slight decrease from the recessionary years but an identical share to a decade ago.
- There were declines in shares of zero, one, and two car households but an increase in the share of 3+ car households.
- 72.5% of 20 to 24-year-olds drove alone to work versus the national average of 76.6%; that segment of the millennial population is not changing commuting behaviors very quickly.
- Big three states, California, Texas, and Florida contain 26% of the workforce and captured 36% of the growth in workers since 2010. Of the three states, California is most similar to the nation in commuting mode choice. In California, since 2010, drive alone, rail transit, bicycle, and work-at-home grew faster than employment, whereas, bus transit and walking grew slower and carpooling declined.
To learn more about commuting trends, take advantage of the new ACS data or watch for updates from other sources. AASHTO hosts a Census Transportation Planning Products Program website, where ACS commuting data tables, specifically multi-year tables, tools that allow analysis of commuting flows, and a comprehensive analysis of longer-term commuting trends are available.
The opinions are those of the author—or maybe not—but are intended to provoke reflection and do not reflect the policy positions of any associated entities or clients. [email protected].

Bay Area Leads the Nation in Reducing Solo Commuters
According to the Census Bureau's American Community Survey on commuting to work, one subregion in the Bay Area can claim accolades for having achieved the largest drop in solo-commuting from 2006, scoring the third lowest drive-alone rate in 2013.

U.S. Census Releases 2013 Commute Data Goodies
The U.S. Census has released data from 2013 that offer planners the most up-to-date data available about where Americans work and how they commute.
Census: Working From Home More Common Than Taking Transit to Work
A more sedentary approach to commuting is now more common than taking the bus or train to work, trailing only driving to work as the most common commute mode.

Manufactured Crisis: Losing the Nation’s Largest Source of Unsubsidized Affordable Housing
Manufactured housing communities have long been an affordable housing option for millions of people living in the U.S., but that affordability is disappearing rapidly. How did we get here?

Americans May Be Stuck — But Why?
Americans are moving a lot less than they once did, and that is a problem. While Yoni Applebaum, in his highly-publicized article Stuck, gets the reasons badly wrong, it's still important to ask: why are we moving so much less than before?

Research Shows More Roads = More Driving
A national study shows, once again, that increasing road supply induces additional vehicle travel, particularly over the long run.

Using Old Oil and Gas Wells for Green Energy Storage
Penn State researchers have found that repurposing abandoned oil and gas wells for geothermal-assisted compressed-air energy storage can boost efficiency, reduce environmental risks, and support clean energy and job transitions.

How Protecting Kauaʻi’s Forests Safeguards Fresh Water
A University of Hawaiʻi study shows that protecting Kauaʻi’s native forests from invasive species significantly boosts groundwater recharge, making it a cost-effective strategy to secure fresh water and enhance climate resilience.

Gary, Indiana to Expand Transit Service, Bike Share
The city plans to launch a bike share system in April and expand service on its bus routes.
Urban Design for Planners 1: Software Tools
This six-course series explores essential urban design concepts using open source software and equips planners with the tools they need to participate fully in the urban design process.
Planning for Universal Design
Learn the tools for implementing Universal Design in planning regulations.
City of Moreno Valley
Institute for Housing and Urban Development Studies (IHS)
City of Grandview
Harvard GSD Executive Education
NYU Wagner Graduate School of Public Service
City of Cambridge, Maryland
Newport County Development Council: Connect Greater Newport