


As planners we use maps on a daily basis. This article shares how to find the date and time that a Google Earth image was taken, which can be helpful in undertaking site analysis and understanding parking utilization.

Over the past year I have been involved in a number of development permit applications. One of the key points of controversy is over how much parking will be needed—and, therefore, how much traffic will be generated. In each case, the developer, staff, and public all offer their perspective on how much parking will be needed. I am sure you have heard about, or been in, public meetings where the public raises significant concerns over the amount of traffic that will be created and whether there will be enough parking. In some cases a traffic impact study is developed that uses ITE figures to model the projected parking demand. Yet, sometimes what you really need is local data.
The typical way we would go about collecting local data is to go stand in a parking lot and count the number of vehicles and the amount of movement in and out of the parking lot over a period of time. This is a time-consuming endeavor to capture even one observation.
This lead me to wonder whether there is a simple, less time intensive way to understand how much parking is being used in our communities. Brittany Kubinski (@B_Kubinski) and I (@EvansCowley) dug in and began to experiment with Google Earth imagery. Google Earth is a free, internet-based software that displays satellite images of location son the earth’s surface, with a resolution of 15 meters or higher. Within Google Earth, planners have access to a plan view or a streetview (from a height of approximately 2.5 meters). This allows the viewer to see the site from above and from the ground. This highly detailed imagery allows for the possibility of site analysis.
As an experiment, Brittany Kubinski and I decided to document parking use at 104 sites in the Columbus, Ohio region and 48 in the Tacoma, Washington region (where the two of us happened to be located). The sites selected were based on the presence of a grocery store or big box retailer and included both urban and suburban sites. Sites were selected based on a Google Maps search for common grocery and big box retailers in each region.
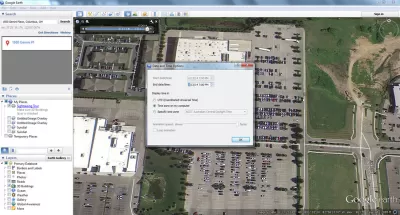
For each retailer, we pulled up the location in Google Earth. For example, for the Costco at 1500 Gemini Place in Columbus, Google Earth has aerial imagery of the site on 20 occasions since 1988, of which five have been captured since the date the Costco opened. A helpful function in Google Earth is to use the toolbar to move from image to image. In the toolbar, the month and year are displayed. Selecting the date and time options shows the actual date an image was taken.
Google Earth image of Costco at 1500 Gemini Place in Columbus, Ohio on June 13, 2014

Selecting the wrench tool in the timeline shows the date at which the image was taken.

The date is important, but to be useful in understanding parking we need to know the time of day the image was taken. Google Earth does not include the actual time (note a time is displayed in date and time options, but this is not the actual time the image was taken).
To find the time of day, a sundial is needed. A sundial is a simple way to tell time by the movement of the shadow over the course of a day. In aerial images shadows can be recognized from tall objects like flag polls, trees, and buildings. These objects can be used as a reference. The challenge is that the shadow that is cast is dependent on the day and location. For example, the days are shorter in the winter and longer in the summer. SunCalc is an easy to use tool that allows you to determine the time of day of an aerial image. To start, simply type in the location and date and year you want to examine. This will pull up a sundial and information on sunrise and sunset. Note that the aerial image that appears is at your location of interest, but is not the same image you may have in Google Earth. It is ideal to have a Google Earth image open next to a SunCalc window to easily see the shadows.
SunCalc allows you to determine the time of day based on location and date

The time can easily be adjusted to get the specified time to match the angle of the shadow on your Google Earth Image. By using SunCalc we can determine that the Google Earth image was taken at approximately 10 am on June 13, 2014. It takes a little effort to go back and forth between the Google Earth image and the SunCalc. The Royal Museums Greenwich has a nice demonstration graphic that shows how a sundial works.
Now knowing the time of day, one can then count the number of vehicles parked in the parking lot, along with the number of spaces to calculate an occupancy rate. The data for this time and date can be combined with the data for the other times and dates for this location. We plan to use this data and combine it with other data, such as using Google Earth to calculate the size of the store and combining this information with information on zoning requirements for number of parking spaces. Our hope is to create a clearer understanding of the use of parking by land use across a region.
Parking is just one example of how the time and date information can be helpful in site analysis. I am curious to hear what other ways you think Google Earth would be helpful in your work.

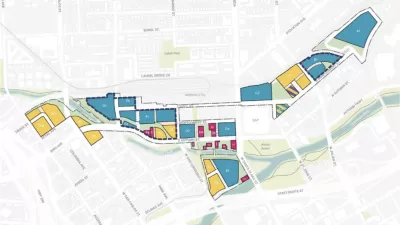
Google's Big Mixed-Use Plans for Downtown San Jose Come Into Focus
Google's plan for a mixed-use transit village at a mile-long site near the Diridon Station in San Jose has a newly released planning document available for public review.

Parking Study: Scooter Scofflaws Far Outnumbered by Car Scofflaws
The worst offenders of parking violations on the streets today aren't scooters—they're food delivery and ride-hailing drivers.

Visualizing Worst-Case Scenario Sea Level Rise on the Texas Coast
Much of the state political leadership in Texas has been slow to accept the existence of climate change, much less the role of the state's economy, land use, and infrastructure planning in exacerbating the crisis. Maybe this will help wake them up?

What ‘The Brutalist’ Teaches Us About Modern Cities
How architecture and urban landscapes reflect the trauma and dysfunction of the post-war experience.

‘Complete Streets’ Webpage Deleted in Federal Purge
Basic resources and information on building bike lanes and sidewalks, formerly housed on the government’s Complete Streets website, are now gone.

The VW Bus is Back — Now as an Electric Minivan
Volkswagen’s ID. Buzz reimagines its iconic Bus as a fully electric minivan, blending retro design with modern technology, a 231-mile range, and practical versatility to offer a stylish yet functional EV for the future.

Healing Through Parks: Altadena’s Path to Recovery After the Eaton Fire
In the wake of the Eaton Fire, Altadena is uniting to restore Loma Alta Park, creating a renewed space for recreation, community gathering, and resilience.

San Diego to Rescind Multi-Unit ADU Rule
The city wants to close a loophole that allowed developers to build apartment buildings on single-family lots as ADUs.

Electric Vehicles for All? Study Finds Disparities in Access and Incentives
A new UCLA study finds that while California has made progress in electric vehicle adoption, disadvantaged communities remain underserved in EV incentives, ownership, and charging access, requiring targeted policy changes to advance equity.
Urban Design for Planners 1: Software Tools
This six-course series explores essential urban design concepts using open source software and equips planners with the tools they need to participate fully in the urban design process.
Planning for Universal Design
Learn the tools for implementing Universal Design in planning regulations.
City of Albany
UCLA Lewis Center for Regional Policy Studies
Mpact (formerly Rail~Volution)
Chaddick Institute at DePaul University
City of Piedmont, CA
Great Falls Development Authority, Inc.
HUDs Office of Policy Development and Research