


Studies often show that bicyclists find "safety in numbers." Norman Garrick and Wes Marshall explain that the street design strategies that attract bike riders are the same ones that improve road safety for all road users.

Davis, California. Photos by the author.
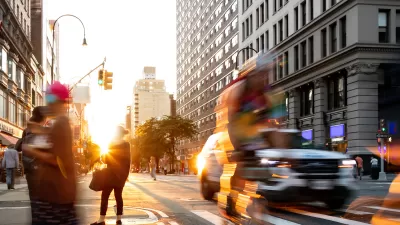
Davis, California, is widely celebrated as the bicycling capital of the United States with over 16% of the population commuting to work on bikes. What is less well known is the fact that the traffic fatality rate in Davis is also unusually low, at about 1/10th of the California statewide rate. Although this fact is not widely disseminated, there is growing data showing that cities with very high use of bikes for routine transportation almost always have much lower than average traffic fatality rates.
The finding that most bike friendly cities are safer than average has been reinforced by the recent experience of cities such as Cambridge, MA, Portland, OR, and New York. These cities have garnered much press for their success in dramatically increasing bike use over the last several years. This increase in bike ridership has corresponded with an equally dramatic decrease in traffic fatality rates in all three cities.
Interestingly, the decrease in fatality occurred not just for people on bikes, but for all classes of road users – including people in cars and people on foot. In other words, the increase in bike use has benefited all road users by helping transform the streets into safer places.
So what is the cause of this beneficial relationship between bike use and traffic safety in so many American cities? In the early 2000s, Peter Jacobsen, one of the first researchers to report on the subject of high biking cities being safer, suggested that the cause was ‘safety in numbers'. He stated that high bike use cities were generally safer than others because the very presence of bikers conditioned drivers to behave with more care. Since then, the 'safety in numbers' hypothesis has been routinely offered as the default explanation for any improvement in safety associated with increased bike use.

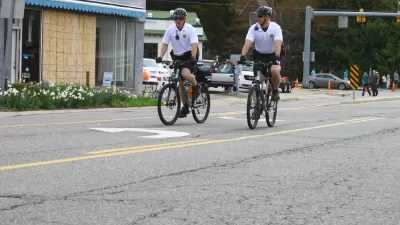
Bike lanes and track in Alameda, California.
While there is undoubtedly much truth to the idea of 'safety in numbers,' this explanation by itself is incomplete and leaves many questions unanswered. For one, it does not provide any guidance about how to increase bike numbers to a point that will bring about increased safety. Also, it founders on the classic chicken and egg problem. Do high numbers of bikers bring about safety or does a perception of safety bring out more bikers?
The key issue for cities trying to improve their biking environment is for them to understand the strategies that will be most effective for achieving their goal of a safer, more sustainable transportation system. Their cause would be aided by having a better understanding of the underlying factors contributing to the safety of existing bike friendly cities. For example, it would be useful to know the key differences in transportation infrastructure that set bike friendly communities apart from other cities. Also, is there evidence to suggest that these differences contribute to safety?
Recently, in the journal Environmental Practice, we published Evidence on Why Bike-Friendly Cities are Safer for All Road Users, which examined eleven years of traffic safety records for 24 medium-sized California cities with various levels of bike use. One goal of our study was to assess how differences in street and street network design might contribute to higher numbers of bike users and, concurrently, to a better traffic safety record.
Initially, we found that the 24 cities in our study could be divided into 4 distinct groups: 4 high biking cities, 4 medium biking use cities, and two groups of cities with low bike use (4 low biking cities with a low traffic fatality rate and 12 low biking cities with a high traffic fatality rate).
To best highlight the salient differences between the four groups of cities, we limit this discussion to two of the four groups: the high biking cities and the low biking/high fatality cities. We found that the high biking cities averaged 2.5 fatalities per year per 100,000 residents compared to almost 9 deaths per 100,000 for the low biking cities. Moreover, all classes of road users were at greater risk in the low biking cities. For people in vehicles, the fatality level was on average 4 times higher in the low biking cities. This is perhaps not surprising, since there were more people driving in the low biking cities.
What is surprising, and disconcerting, is that there were twice as many bike fatalities in these low biking cities compared to the cities with many, many more bike riders. In other words, for anyone brave enough to use a bike in these low biking cities, the risk of injury or death was astronomical. Conversely the traffic fatality risk from biking riding in bike friendly cities is much lower than is generally recognized.
It important to note that this disparity in fatality rates between cities was not necessarily due to fewer accidents – in fact, the high biking cities had more fender benders than did the low biking cities. Instead, the difference in fatality rates between the cities related to difference in the severity of the crashes that did occur. In other words, most crashes in the high biking cities resulted in little or no injury, while a much higher percentage of accidents resulted in a catastrophic outcome – either severe injury or death – in the low biking cities with high fatality rates.

This is a key finding, because it points to one important difference between the groups of cities. The results strongly suggest that crashes in the safer cities are occurring at lower speeds and, as such, the result of any given crash is less catastrophic. We have not yet conducted speeds measures in all 24 cities, but in the 6 cities that we have sampled, the measured speeds on major streets in the safer cities (the high and medium bike use cities) are significantly lower than in the low biking cities.
Although the 'safety in numbers' effect might account for some amount of disparity in vehicle speed, it is likely that a bigger factor is related to the design of the street and the street network in the various cities. Our data provides strong evidence for this conclusion. For example, we discovered that the street network density in the high biking cities is almost twice that in the low biking cities with high fatalities.
The cross-section of the major streets was also different. In general, the streets in the high biking cities were narrower by about 3 ft on average. This is not a huge difference, but these cities with narrower streets also do much more within their street cross-sections, since they have far more miles of on-street parking and bike lanes.
Taken together, these street and street network characteristics of our high bike use cities add up to an environment that is likely much more attractive for the causal bike rider.
We also know that the cities like Cambridge, Portland, and New York – that have had recent success in increasing bike use – have often taken steps to reduce motor vehicle speeds and volumes on streets with bike facilities or bike facility crossings. They have done this by reducing space for cars and adding space for bikes. They have also employed traffic-calming strategies and focused on providing safe opportunities for people on bikes to cross the busier roads. In other words, they have made changes that make their streets more like the streets in the high biking cities in our study. So it is perhaps not surprising that these cities have also seen a reduction in the traffic fatality rate to a level comparable to that in our high biking cities.
There is also evidence to suggest that just putting down paint to create bike lanes next to fast moving traffic may not get the job done. In fact, a few of our low biking cities did have extensive bike lanes on major arterials. However, these cities have not been successful and never saw the biking numbers, or the safety benefits.
Ultimately 'safety in numbers' does not just happen. Instead, our research suggests that the same strategies that attract bike riders are the same ones that improve road safety for all road users. Cities should indeed strive for 'safety in numbers' but before they can get to that point, they need to create bicycle friendly streets that will make it comfortable enough for the average Jane and Joe to take up biking. It is this act of creating comfortable and complete biking networks that ultimately results in both making cities biking friendly and, at the same time, making biking friendly cities safer for all users.

Research: Bike Rolling-Stop Laws Don’t Lead to Unsafe Behavior
Rolling stops by bicyclists get a bad rap, particularly among motorists who perceive them to be breaking the law. But new research shows laws that allow for rolling stops for cyclists do not lead to unsafe behavior by either group.

Climate Action: As Simple as Riding an E-Bike
A new e-bike credit, if coupled with improved bike safety infrastructure, could encourage many Americans to replace short car trips with e-bike rides, reducing emissions and congestion.
Virginia's Proposed Bicycle Safety Act Puts the Onus on Drivers
Three-foot passing rules are safe. Requiring drivers to change lanes to pass people on bikes are even safer.

Planetizen Federal Action Tracker
A weekly monitor of how Trump’s orders and actions are impacting planners and planning in America.

Chicago’s Ghost Rails
Just beneath the surface of the modern city lie the remnants of its expansive early 20th-century streetcar system.

San Antonio and Austin are Fusing Into one Massive Megaregion
The region spanning the two central Texas cities is growing fast, posing challenges for local infrastructure and water supplies.

Since Zion's Shuttles Went Electric “The Smog is Gone”
Visitors to Zion National Park can enjoy the canyon via the nation’s first fully electric park shuttle system.

Trump Distributing DOT Safety Funds at 1/10 Rate of Biden
Funds for Safe Streets and other transportation safety and equity programs are being held up by administrative reviews and conflicts with the Trump administration’s priorities.

German Cities Subsidize Taxis for Women Amid Wave of Violence
Free or low-cost taxi rides can help women navigate cities more safely, but critics say the programs don't address the root causes of violence against women.
Urban Design for Planners 1: Software Tools
This six-course series explores essential urban design concepts using open source software and equips planners with the tools they need to participate fully in the urban design process.
Planning for Universal Design
Learn the tools for implementing Universal Design in planning regulations.
planning NEXT
Appalachian Highlands Housing Partners
Mpact (founded as Rail~Volution)
City of Camden Redevelopment Agency
City of Astoria
City of Portland
City of Laramie