


This year, the first data from the new annual American Community Survey rolled out to complement the decennial Census. But planners should recognize that while the data is more up-to-date, the margin of error is much wider, according to Census researcher and planning professor Heather MacDonald.
 This summer and fall, the first round of American Community Survey data was released by the U.S. Census Bureau. Those who watched the ACS's progress through a rocky Congressional debate will know that the survey will replace the portion of the decennial census that provided the detailed socio-economic, travel, housing, and other data that many planners rely on for basic analyses. Instead of dealing with data that is somewhere between two-and-a-half and 12 years out of date, we'll now have annual data for places with 65,000 people or more. As the ACS phases in, annual releases beginning in 2008 will cover communities between 20,000 and 65,000 (based on three-year averages), and by 2010 we'll have annual releases for all sizes of communities, including census tracts (based on five-year averages). We're in the process of moving from a once-a-decade snapshot of communities to something closer to a continuous video stream. But, to stretch that metaphor further, the "video" profile of characteristics will be substantially less precise than the snapshot.
What will this mean for planners? While the methodological details of census surveys may seem about as exciting as cold french fries, they matter because they change the way we understand and measure society. First, the ACS redefines "who lives here". While the 2000 census counted people at their "permanent place of residence" (where they lived the majority of the year), the ACS counts them where they live at the time the monthly survey is conducted (as long as they're living there at least two months). Thus, places with large influxes of affluent retirees in winter will likely see increases in household median incomes. Places with large seasonal populations of low income migrant workers may appear to become "poorer" overnight. Because the population will still be enumerated as the Constitution requires every decade, this won't affect the local population numbers that drive Congressional redistricting. However, it will alter the profile of many communities. This makes sense - populations are fluid, and actual social needs may look quite different than we would expect based on a profile collected on April 1, once a decade.
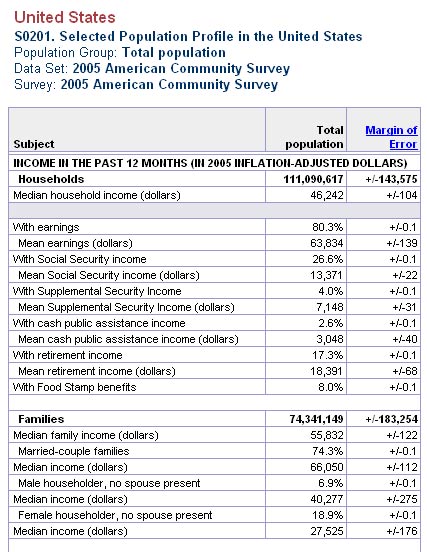
Second, the ACS is based on a much smaller sample (about 2.5%) than the decennial survey (just less than 17% in 2000). Consequently, sample error is larger (about 1.33 times the size of sample error in the 2000 Census), and ACS estimates are less precise. You'll notice the confidence intervals now reported alongside every ACS estimate. Of course, most of the census data we used in the past had sample error; few of us bothered to calculate the confidence intervals however. We also paid relatively little attention to how those intervals varied for different sorts of information. For small population sub-groups (i.e. the number of pedestrian commuters) estimates were always much less precise than for larger sub-groups (i.e. the number commuting alone in a car). For many variables then, ACS estimates can end up being frustratingly imprecise. How can we address an apparent increase in overcrowding if the change isn't statistically significant?
It's important to keep this imprecision in perspective though. In the past, because census data was so soon stale, we relied on projection methods (either our own or those constructed by commercial data providers) that introduced all sorts of unspecifiable error into our estimates. Projections are notoriously unreliable in rapidly-changing or smaller places. At least we can understand and account for the sample error the ACS entails. In addition, the Census Bureau argues that because the ACS employs professional interviewers and will collect information only from the specified sample household, not neighbors (as the decennial census does), it will have lower non-sample error than the decennial census (comparative tests run in 2000 support this).
Third, continuous surveys are conceptually different to point-in-time surveys: they report averages not integers. This may seem like a picky philosophical point, but it has significant implications for how we can use data. Consider a state that allocates Low Income Housing Tax Credits using indicators of housing need. Those indicators will now be updated annually rather than once a decade, but the updates will be based on different rolling averages for different size places. An annual average released for a large metropolitan county may show a sharp increase in rental affordability problems. The average released that year for a small rural county with identical experience to the metro county would be based on a five year average, which would substantially smooth out the one-year peak. It would not be legitimate to use "most recent available" data for every competing county; to be fair, allocations would have to compare the five-year average for all size counties. This may be a highly contentious decision, especially when strong evidence of need is available for some places but not others.
So, what can planners do to make best use of the ACS without succumbing to its pitfalls? We need to become more sophisticated communicators of the quality of the data we present, not just its apparent meaning. We also need to be more proactive in improving the quality of local ACS data. Educating people about the ACS and how it's used may help improve response rates (it was simple to mount a marketing campaign for the 2000 Census, but very difficult to do so for a continuous survey like the ACS).
Perhaps equally important is the role we can play in improving the quality of the sample by improving the accuracy of the universe from which it's drawn - the Master Address File. Currently, the Census Bureau's address file is based on US Postal Service Delivery Sequence Files, in principle reviewed and corrected by local governments. But not everyone gets mail where they live, and as we all know, not everyone wants to be counted. The differential undercount of some people - renters, immigrants, young African-American males - plagues the census enumeration. Although the ACS is not an enumeration, if some residents are systematically excluded because the illegally converted apartment or rural mobile home they live in are not on the Master Address File, we will indeed have substantial non-sample error. Integrating address file updates with local GIS systems will help. But identifying every informal and illegal residence is difficult even for staff of the agencies that are responsible for enforcing building codes and local ordinances. Delegating some of these responsibilities to community based organizations may side-step the problem, but raise different problems of oversight.
On balance, the trade off is probably worthwhile. In June this year, the Census Bureau was able to release 2005 ACS data for the devastated communities of the Gulf Coast. While semi-current data will not solve the massive challenges of reconstructing communities, it offers at least some basis for difficult decisions.
Heather MacDonald teaches in the Urban and Regional Planning program at the University of Iowa. Her recent research focuses on the dilemmas planners encounter in using secondary data. Part of this interest developed out of several research projects assessing state housing and community development needs and policy responses. Her book Unlocking the Census with GIS (co-authored with Alan Peters) was published by ESRI in 2004.
This editorial is based on an article published in the Journal of the American Planning Association (JAPA) in Fall 2006. The full JAPA article is available online at ProQuest.
Related Links:
Beginning in January 2007, Planetizen will be offering an online course to help planners understand and use Census and ACS data. Learn more about PLAN-120: Introduction to Census Data, ACS, and Growth and the other Planetizen Courses.


Manufactured Crisis: Losing the Nation’s Largest Source of Unsubsidized Affordable Housing
Manufactured housing communities have long been an affordable housing option for millions of people living in the U.S., but that affordability is disappearing rapidly. How did we get here?

Americans May Be Stuck — But Why?
Americans are moving a lot less than they once did, and that is a problem. While Yoni Applebaum, in his highly-publicized article Stuck, gets the reasons badly wrong, it's still important to ask: why are we moving so much less than before?

Research Shows More Roads = More Driving
A national study shows, once again, that increasing road supply induces additional vehicle travel, particularly over the long run.

Judge Halts Enforcement of Anti-Homeless Laws in Grants Pass
The Oregon city will be barred from enforcing two ordinances that prosecute unhoused residents until it increases capacity and accessibility at designated camping sites.

Advancing Sustainability in Los Angeles County Schools
The Los Angeles County Office of Education’s Green Schools Symposium brings together educators, students, and experts to advance sustainability in schools through innovative design, climate resilience strategies, and collaborative learning.

Using Old Oil and Gas Wells for Green Energy Storage
Penn State researchers have found that repurposing abandoned oil and gas wells for geothermal-assisted compressed-air energy storage can boost efficiency, reduce environmental risks, and support clean energy and job transitions.
Urban Design for Planners 1: Software Tools
This six-course series explores essential urban design concepts using open source software and equips planners with the tools they need to participate fully in the urban design process.
Planning for Universal Design
Learn the tools for implementing Universal Design in planning regulations.
City of Moreno Valley
Institute for Housing and Urban Development Studies (IHS)
City of Grandview
Harvard GSD Executive Education
NYU Wagner Graduate School of Public Service
City of Cambridge, Maryland
Newport County Development Council: Connect Greater Newport